Sterling Pound Rises Toward 1.26000 On Weaker U.S. Dollar As Markets Prepare For The Latest U.S. Consumer Inflation Report


Key Takeaways:
- GBP/USD rose toward $1.26000 on Wednesday during the Asian session, supported by a combination of factors
- The latest U.K. Labor report reinforced market bets that the U.K. central bank could soon start cutting rates
- Hotter-than-expected US wholesale inflation report gets overlooked by the generally downbeat surrounding the buck, which acts as a tailwind to GBP/USD
- Markets await the release of the critical U.S. inflation data report that will help guide the Fed's interest rate outlook
The Great British Pound appreciated toward $1.26000 on Wednesday during the Asian session, rising to its most substantial level in nearly two weeks as investors continued to digest the latest U.K. jobs and wages data and its implication on the BoE monetary policy outlook while awaiting further evidence of stubborn inflation in the U.S.

A UK Office for National Statistics (ONS) report released on Tuesday showed average weekly earnings, including bonuses in the U.K., increased 5.7% year-on-year to GBP 682/week in the three months to March 2024, the same as an upwardly revised 5.7% in the previous period and above forecasts of 5.3%. Additionally, the U.K.'s unemployment rate rose to 4.3% from January to March 2024, slightly up from 4.2% in the three months to December 2023, aligning with market expectations. To a greater extent, the combination of data reinforced market bets that the U.K. central bank could soon start cutting rates. The probability of a BoE June rate cut increased slightly to 50% following the labor report, and traders continue to bet the central bank would deliver two quarter-point cuts by the end of the year.
A weaker U.S. dollar was a tailwind to the GBP/USD pair and helped keep the shared currency under bullish pressure amid the risk-averse. This comes as investors brushed aside hotter-than-expected producer inflation data for April, although the March reading was revised sharply lower. Official data showed factory gate prices in the U.S. increased by 0.5% in April 2024, following a downwardly revised 0.1% fall in March, which was much higher than forecasted at 0.3%.
The risk-off mood ahead of today's critical U.S. consumer price inflation data report also continues to undermine the greenback and has assisted the GBP/USD cross in attracting further buying at higher levels. According to a preliminary report, consumer price inflation in the U.S. is expected to have remained unchanged at 0.4% in April, while excluding food and energy, the so-called core inflation is expected to have moved slightly lower to 0.3% in April from 0.4% in March.
Despite this, the Federal Reserve Chairman Jerome Powell, on Tuesday, while speaking to the annual general meeting of the Foreign Bankers' Association in Amsterdam, said
the PPI numbers were higher than he thought anybody expected," Powell further said that what those PPI numbers have told them is that they will need to be patient and let restrictive policy do its work. To some extent, this remains supportive of the greenback and might help limit gains around the major currency pair; however, due to the generally downbeat mood surrounding the greenback, this fails to lend any support to the buck, significantly ahead of today's U.S. consumer inflation report.
The sour mood surrounding the safe-haven buck saw the odds for a Fed rate cut remain at 65% in September and 78% for November despite initially falling after the release of the PPI report and Powell's speech.
In the future, investors look forward to the U.S. docket featuring the release of the key U.S. CPI and Core CPI (MoM) (Apr) data report. Traders will further look for cues from the release of the U.S. Retail Sales (MoM) (Apr), N.Y. Empire State Manufacturing Index (May), and Kashkari and Bowman Fed officials' speeches.
Technical Outlook: One-Day GBP/USD Price Chart
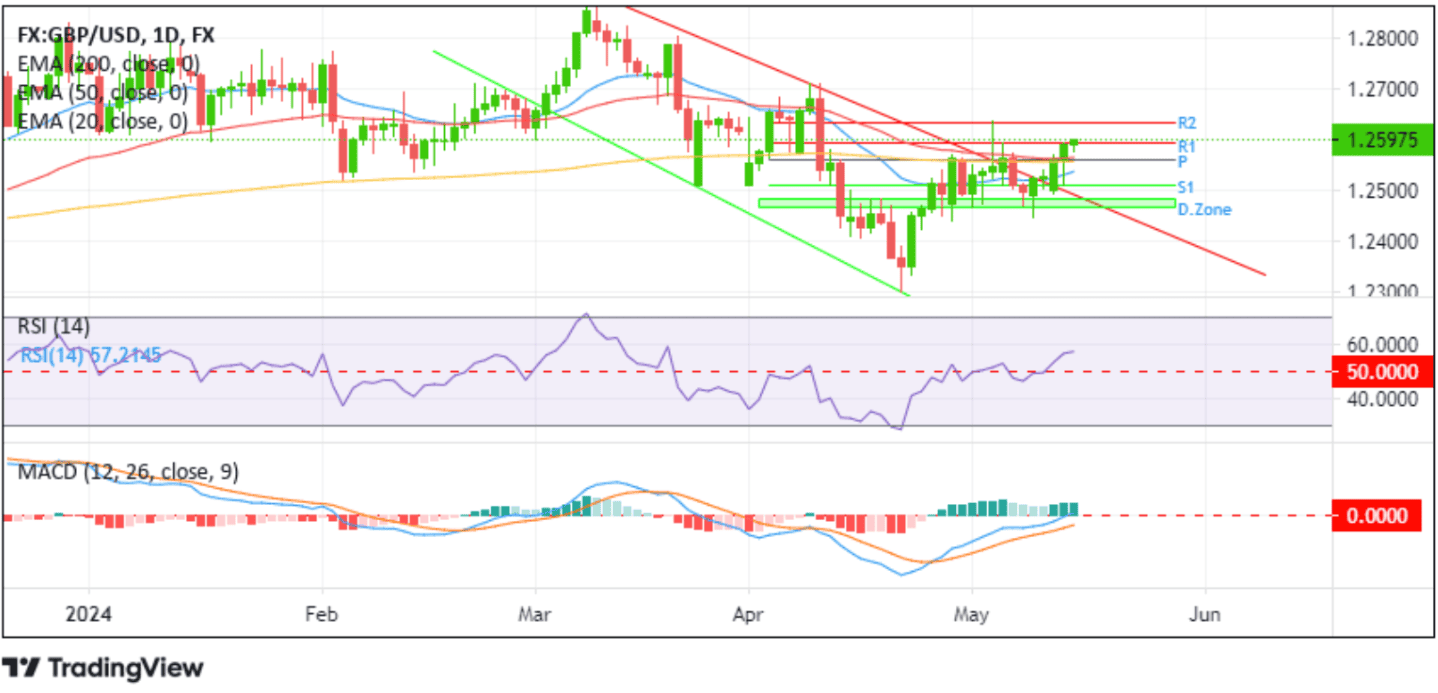
From a technical standstill using a one-day price chart, the price's ability to break above the upper limit of the multi-week descending channel pattern extending from the early-March 2024 swing higher-high favored bulls and supported the case for further buying around the major currency pair. A further increase in buying pressure from the current price level in the coming sessions will pave the way for a rise toward the $1.26338 resistance level (R2). A clean move above this level, which holds buy-side liquidity, will affirm the bullish bias and pave the way for an elevated rise toward the $1.27000 round mark.
On the flip side, the 1.25926 level (R1) now protects the immediate downside for the GBP/USD pair. However, if sellers manage to breach this move followed by finding acceptance below the pivot level (p) at $1.25605 which coincides with the technically strong 200-day (yellow) Exponential Moving Average (EMA), this would catapult a dive toward the $1.25108 level (S1), and in highly bearish cases the GBP/USD cross could extend a leg down toward to retest the critical resistance level of the multi-week descending channel pattern, about which if price breaks decisively below this level downside pressure could pick further pace paving the way for a decline toward the demand zone (D.Zone) ranging from 1.24833 - 1.24664 levels.