Silver Weakens Further Below 23.000 Mark As Weaker U.S. Dollar Fails To Offer Support, U.S. PPI In Focus


Key Takeaways:
- The Silver (XAG/USD) price moves further below the 23.000 mark as the weaker U.S. dollar fails to enlighten the mood
- The mixed August U.S. Inflation data report cements market expectations of a Fed pause during the September meeting
- Any surprises in the incoming data may offer support to the precious grey metal and help limit further losses
- A slew of U.S. macro data are set to be released today, but the main focus remains on the Producer Price Inflation (PPI) data report

XAG/USD pair struggled to capitalize on Thursday’s earlier bounce from the vicinity of the 22.81848 level and witnessed fresh supply during the mid-Asian session to drag spot prices to a new daily low. As of press time, the precious grey metal is trading in modest losses below the 22.700 mark and looks set to keep its offered tone heading into the European session. The ongoing decline in U.S. Treasury bond yields forced the U.S. dollar to ease further below the 104.700 mark on Thursday, which in turn failed to offer any support to silver prices as fresh U.S. macro data released on Wednesday indicated that the Federal Reserve (Fed) would undoubtedly leave its Fed Funds rate unchanged during the September meeting.
A U.S. Bureau of Labor Statistics (BLS) report on Wednesday showed the annual inflation rate in the U.S. accelerated for a second straight month to 3.7% in August from 3.2% in July, above market forecasts of 3.6%. Every month, the inflation rate in the U.S. rose to 0.6%, matching market expectations and going up from 0.2% in July.
However, the annual core consumer price inflation rate in the United States, which excludes volatile items such as food and energy, fell to 4.3% in August 2023, the lowest since September 2021, from 4.7% in the prior month, matching market expectations. Every month, core consumer prices rose by 0.3% from a month earlier in August, up from a 0.2% increase in July and slightly above the market consensus of 0.2%. The mixed U.S. inflation data report comes after another U.S. BLS report released early this month indicated a gradual easing of labor market conditions, suggesting the Fed could likely leave its Fed Funds rate unchanged during its September meeting scheduled for next week.
That said, CME’s Fed Fund Watch Tool shows that Fed fund futures traders have also priced in a 97% chance that the Fed will leave its Fed Funds rate unchanged at 5.25% next week. Nevertheless, markets are still pricing at least one more 25bps rate hike by the Fed by the end of this year, which continues to act as a tailwind to the greenback and would help cap the upside for the XAG/USD price.
As we advance, investors look to the U.S. docket featuring the release of the August Retail and Core Retail Sales (MoM) data report and the Initial Jobless Claims data report for the previous week. The Main focus, however, remains on the Producer Price Inflation (PPI) data for August, which is expected to show a moderate rise in wholesale inflation in the U.S. last month.
Technical Outlook: Four-Hour Silver Price Chart
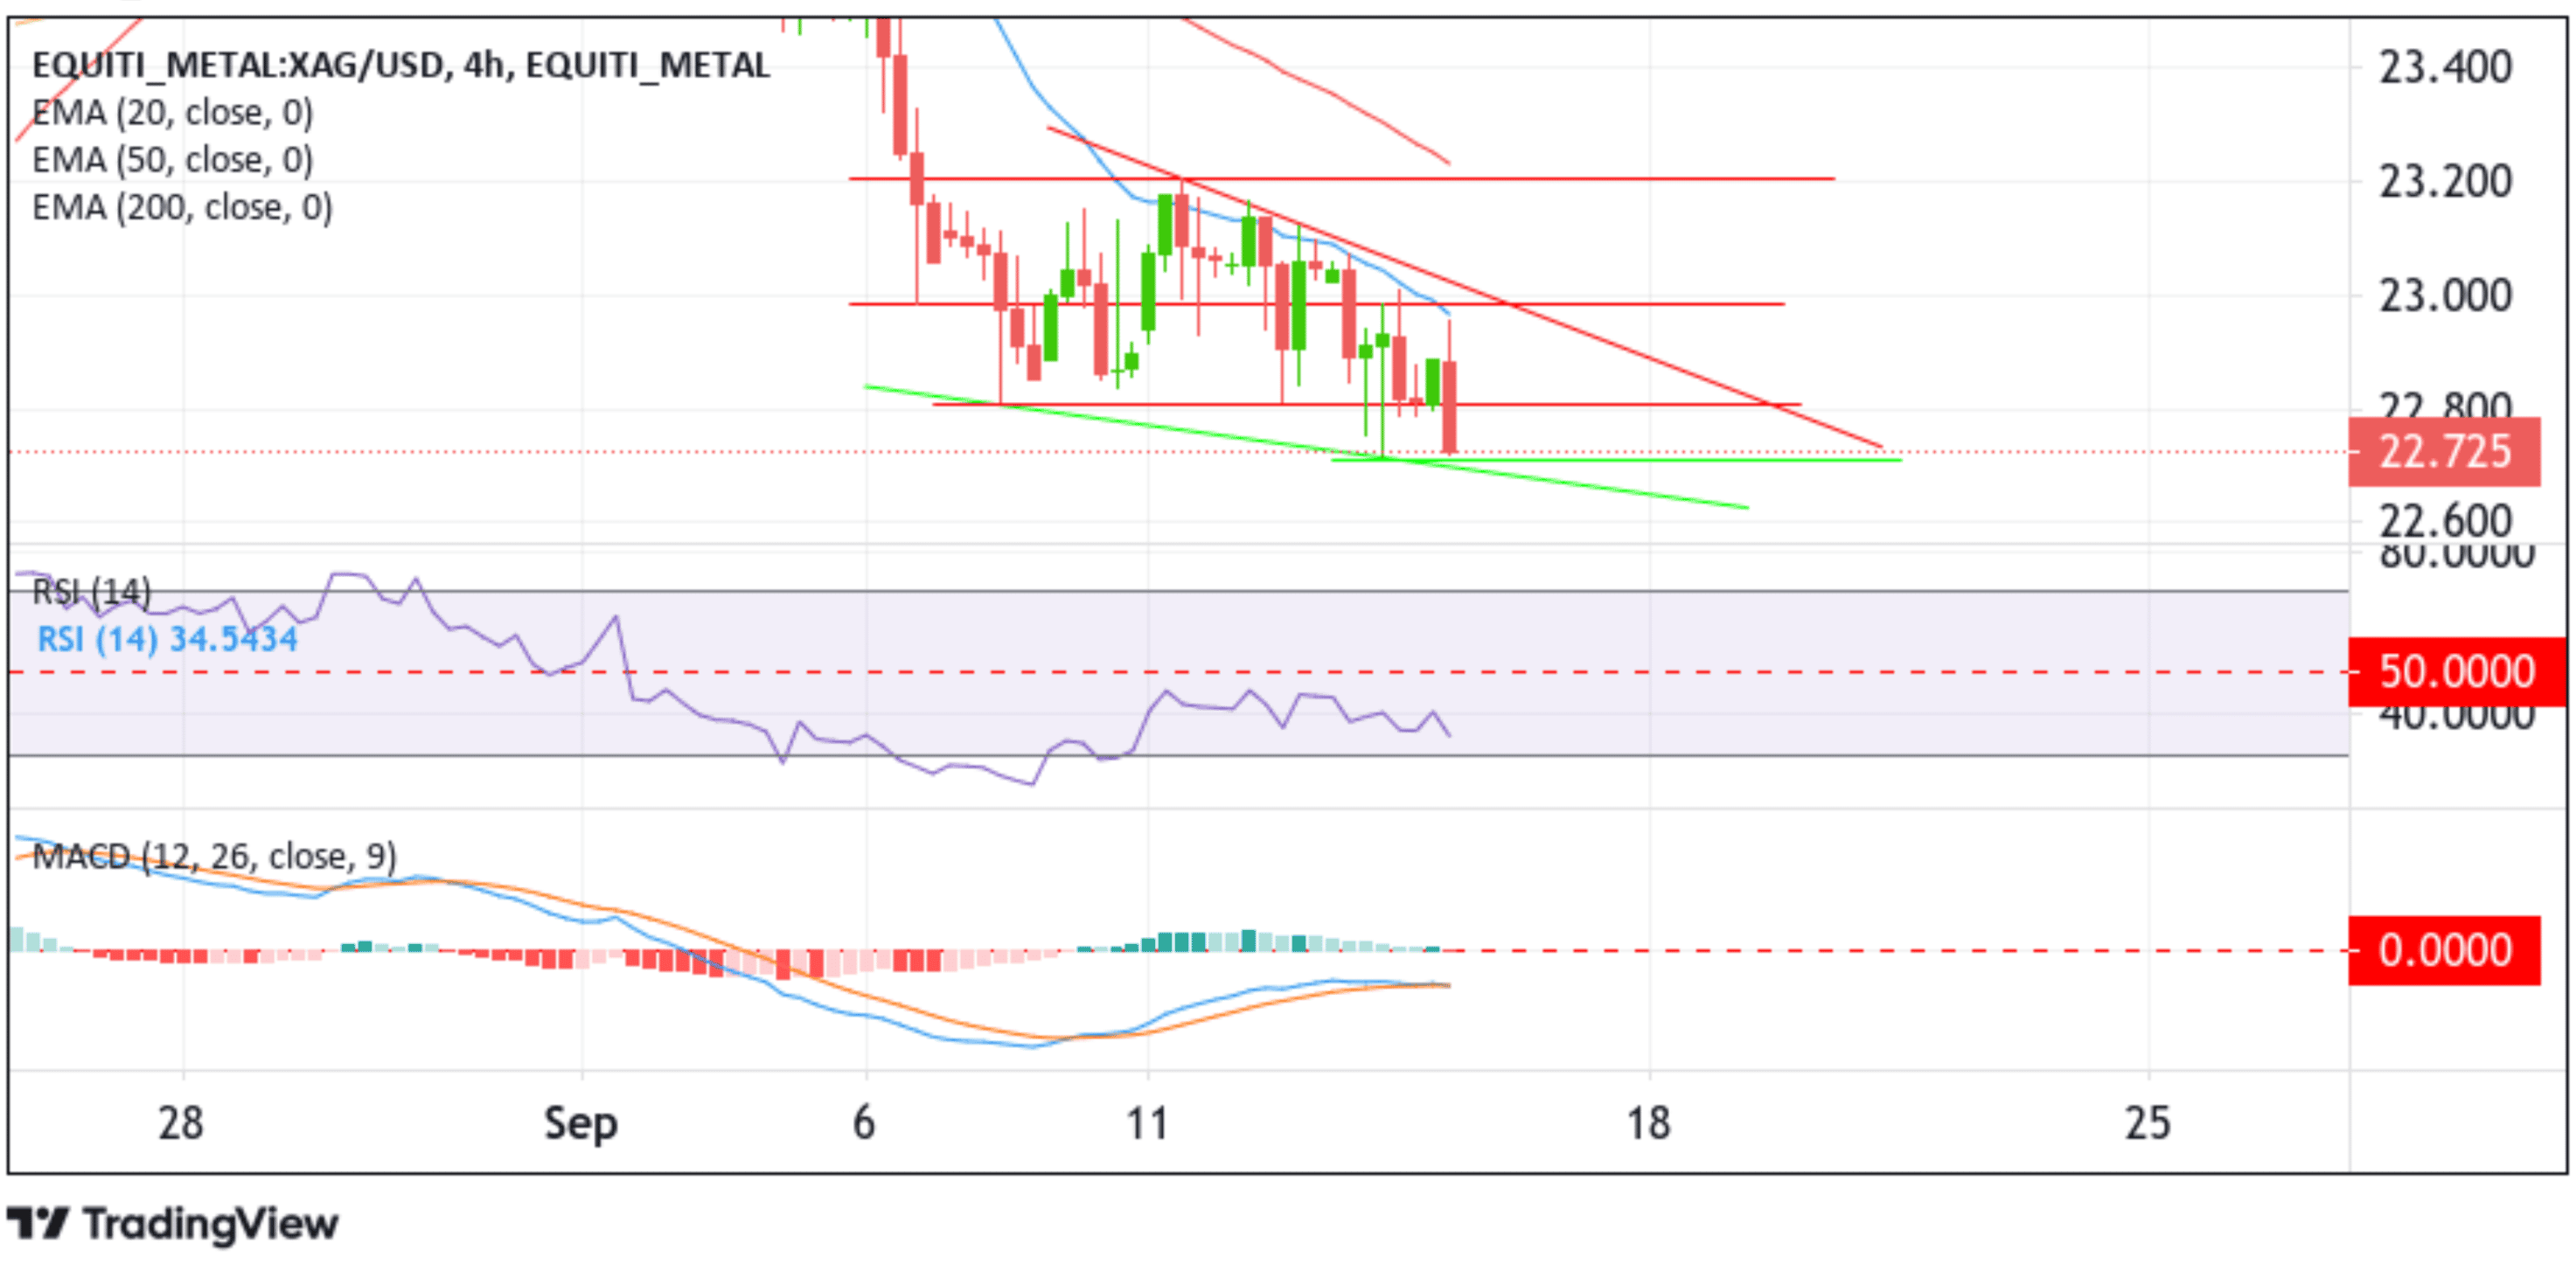
From a technical perspective, a further increase in selling pressure from the current price level would drag spot prices toward the support level at 22.712. On further weakness, the XAG/USD price could drop to the lower limit of the Bullish Falling Wedge chart pattern extending from the September 7, 2023 swing low. A subsequent break (bearish price breakout) below this support level would trigger sellers to continue pushing down the price.
All the technical oscillators (RSI (14) and MACD) on the chart are below their signal lines, suggesting the continuation of the bearish price action. Further supporting the bearish outlook is the acceptance of the price below the technically strong 200-day (yellow) Exponential Moving Average (EMA) at the 23.777 level. Additionally, the 50 (red) and 200 (yellow ) day EMA crossover (Golden Cross) at the 23.704 level further add credence to the bearish thesis.
On the flip side, the 22.809 level now seems to act as an immediate hurdle, above which a bout of short-covering has the potential to lift the silver price back toward retesting the upper limit of the Bullish Falling Wedge chart pattern extending from the September 11, 2023 swing high. If the silver bulls break above this resistance level decisively, the focus will shift toward the 22.984 resistance level. On further strength, the XAG/USD price could accelerate toward the next relevant resistance level at the 23.204 class, which also coincides with the 50-day (red) EMA level.