GBP/USD Rebounds On Failure To Find Acceptance Above The 50% FIB, Markets Eye UK Macro data And U.S. CPI Data


Key Takeaways:
- GBP/USD pair rebounds and moves below the late 1.24000s upon failure to find acceptance above 50% FIB
- A combination of factors assisted the U.S. Dollar (DXY) in attracting some intraday buying on Wednesday and helped limit further GBP/USD gains
- Expectations that the Bank of England (BoE) is almost done with its rate hiking cycle undermine the Cable
- Investors look forward to a slew of UK Macro data for fresh GBP/USD directional impetus, but the main focus remains on the U.S. CPI data

The GBP/USD cross witnessed fresh selling during the Mid-Asian session on Wednesday. It dropped below the late 1.24000s following the price's inability to extend its modest recovery above the 50% Fibonacci retracement level. The shared currency looks set to maintain its offered tone heading into the European session amid the prevalent U.S. dollar buying.
A combination of factors assisted the U.S. Dollar (DXY) in attracting some intraday buying on Wednesday and saw the DXY rebound modestly from the vicinity of the 104.518 level, which in turn was seen as a key factor that helped limit further gains for the GBP/USD cross. The prevalent cautious mood as investors await the release of key inflation data later today has tempered investors' appetite for perceived riskier assets. This was evident from a weaker tone around the equity markets, which could drive more flows towards the GBP/USD cross.
Furthermore, expectations that the Bank of England (BoE) is almost done with its rate hiking cycle also help to cap the upside for the GBP/USD cross. During an interaction with the House of Commons Treasury Committee last week, the U.K.'s Central Bank Governor, Andrew Bailey, said that interest rates may not rise further amid expectations that inflation in the U.K. will fall markedly by the end of 2023. Furthermore, a U.K. Office for National Statistics report released on Tuesday showed a drop in the number of people employed in the U.K. in the three months to July, suggesting that the BOE may be forced to halt its aggressive monetary policy tightening campaign anytime soon.
In contrast, the Federal Reserve (Fed) is expected to lift interest rates by at least 25 basis points (bps) before the end of this year. Increasing market bets for a final 25bps Fed rate hike before 2024 was the U.S. Department of Labor report last week that showed that new unemployment claims in the U.S. fell to their lowest in over six months in the final week of August, surprising market expectations of a moderate increase and challenging recent data that suggested some softening in the labor market. Additionally, the ISM Services PMI in the U.S. unexpectedly rose to a six-month high in August, reflecting resilience to high borrowing costs.
As we advance, investors look forward to the U.K. docket featuring the release of the GDP (MoM) data for July, Manufacturing Production (MoM) data for July, Trade Balance (Jul), and industrial production (MoM) data for July. The main focus, however, remains on the key U.S. CPI data for August, which is expected to show a moderate rise in inflation pressures in the U.S.
Technical Outlook: Four-Hour GBP/USD Price Chart
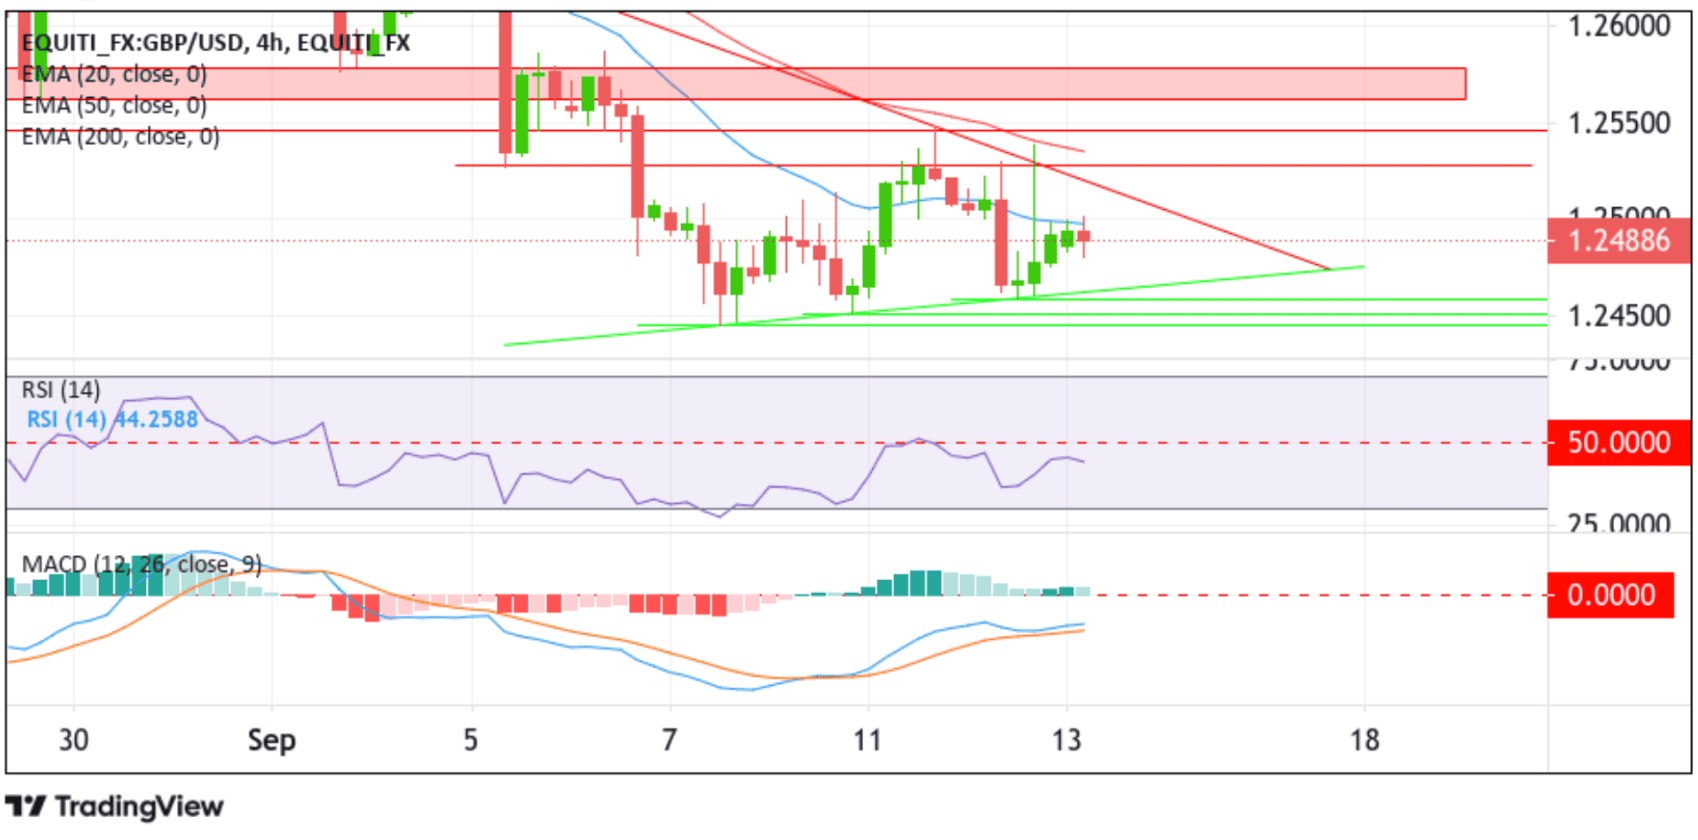
From a technical outlook, the price's failure to find acceptance above the 50% Fibonacci retracement level at the 1.24991 level, which sits below the 1.25000 round mark, favored sellers. An increase in selling momentum beyond the current price level will pave the way for a drop toward the upward ascending trendline of the Bullish Pennant chart pattern extending from the early September 2023 swing low. A subsequent breach (bearish price breakout) below this support level will reaffirm the bearish bias and pave the way for a drop toward the 1.24586 support level en-route to the 1.24504 and 1.24439 support levels. A convincing move below these barriers would cause the GBP/USD cross more vulnerable to further southside moves.
All the technical oscillators on the chart are in negative territory, suggesting the continuation of the bearish price action. Further supporting the bearish outlook is the acceptance of the price below the technically strong 200-day (yellow) Exponential Moving Average (EMA) at the 1.27179 level. Additionally, the 50 (red) and 200 (yellow) day EMA crossover at the 1.27751 level adds credence to the bearish bias.
On the flip side, if buyers resurface and spark a bullish turnaround, initial resistance comes in at the downward-sloping trendline of the Bullish Pennant chart pattern extending from the early September 2023 swing high. A decisive break (bullish price breakout) above this support level would cause the GBP/USD price to ascend toward the 1.25283 horizontal level. On further strength, the focus shifts toward the 1.25476 key resistance level, about which, if the price pierces this barrier, the GBP/USD price could appreciate further toward the 1.25745 - 1.25614 supply zone. Sustained strength above this zone would pave the way for further gains around the GBP/USD cross.