Silver Slides Further Below 22.600 Mark On Sustained U.S. Dollar Demand As Markets Eye FED’s Decision


Key Takeaways:
- Silver extends the bearish momentum below the 22.600 mark to start the month on the back foot
- A stronger U.S. dollar across the board helps exert downward pressure on the XAG/USD cross
- Firm market expectations of a dovish Fed during the November meeting and the ongoing Middle East conflict between Israel and Hamas might help limit further losses around the XAG/USD pair
- Markets Eye Fed’s interest decision for fresh XAG/USD directional impetus, a Fed Pause is fully expected

Silver (XAG/USD) attracted some selling on Wednesday during the early Asian session to start the month on the back foot and extend the sharp bounce from the vicinity of the 23.610 level touched on Monday and dropped to a fresh weekly low pressured by a stronger dollar.
As of press time, the precious grey metal was trading in heavy losses below the 22.600 mark and marked a seventh consecutive session of negative losses as bearish pressure followed by falling demand due to a stronger U.S. dollar weighed on the precious metal.
Firm market expectations that the Fed will hike interest by at least 25 basis points before the end of the year remain supportive of rising U.S. Treasury bond yields, which extend support to the greenback. The U.S. Dollar Index (DXY), which measures the value of the USD against a basket of currencies, rose over 0.08%/(94 points) on Wednesday during the Asian session, extending the modest pullback from the vicinity of the 105.907 level touched on Tuesday and was seen as a key factor that helped exert downward pressure on the XAG/USD cross.
Further weighing on silver was the fresh round of weak Chinese macro data released on Tuesday, which showed the official NBS Manufacturing PMI in China unexpectedly fell to 49.5 in October 2023 from 50.2 in September, missing market forecasts of 50.2, highlighting that the economic recovery in the nation remained fragile with more support measures from the government needed.
Additionally, a U.S. Conference Board (C.B.) report released on Tuesday showed the Conference Board’s Consumer Confidence Index dropped to 102.6 in October from an upwardly revised 104.3 in September but beat market expectations of a 100.00 drop. Moreover, the S&P CoreLogic Case-Shiller 20-city home price index in the U.S. rose 2.2% year-on-year in August 2023, the most significant rise in seven months, following a 0.2% gain in July.
Despite the supporting factors, the precious grey metal remains supported by firm market expectations that the Fed will maintain the status quo for the second straight time in November. Additionally, the ongoing Middle East conflict between Israel-Hamas continues to offer support for the precious grey metal. During times of political uncertainty, investors prefer lower-risk assets compared to high-risk assets, which in turn favors silver and could help limit further losses around the XAG/USD cross.
As we advance, investors look forward to the U.S. docket featuring the release of the ADP Nonfarm Employment Change (Oct), the ISM Manufacturing PMI (Oct), and the JOLTs Job Openings. The main focus, however, remains on the Fed Interest Rate Decision, in which the U.S. Central Bank is expected to keep its benchmark policy rate steady at the current 5.25% to 5.5% during its November meeting. Investors will further monitor how dovish/hawkish the Fed’s chair language will be concerning future monetary policy actions during the post-interest rate announcement press conference.
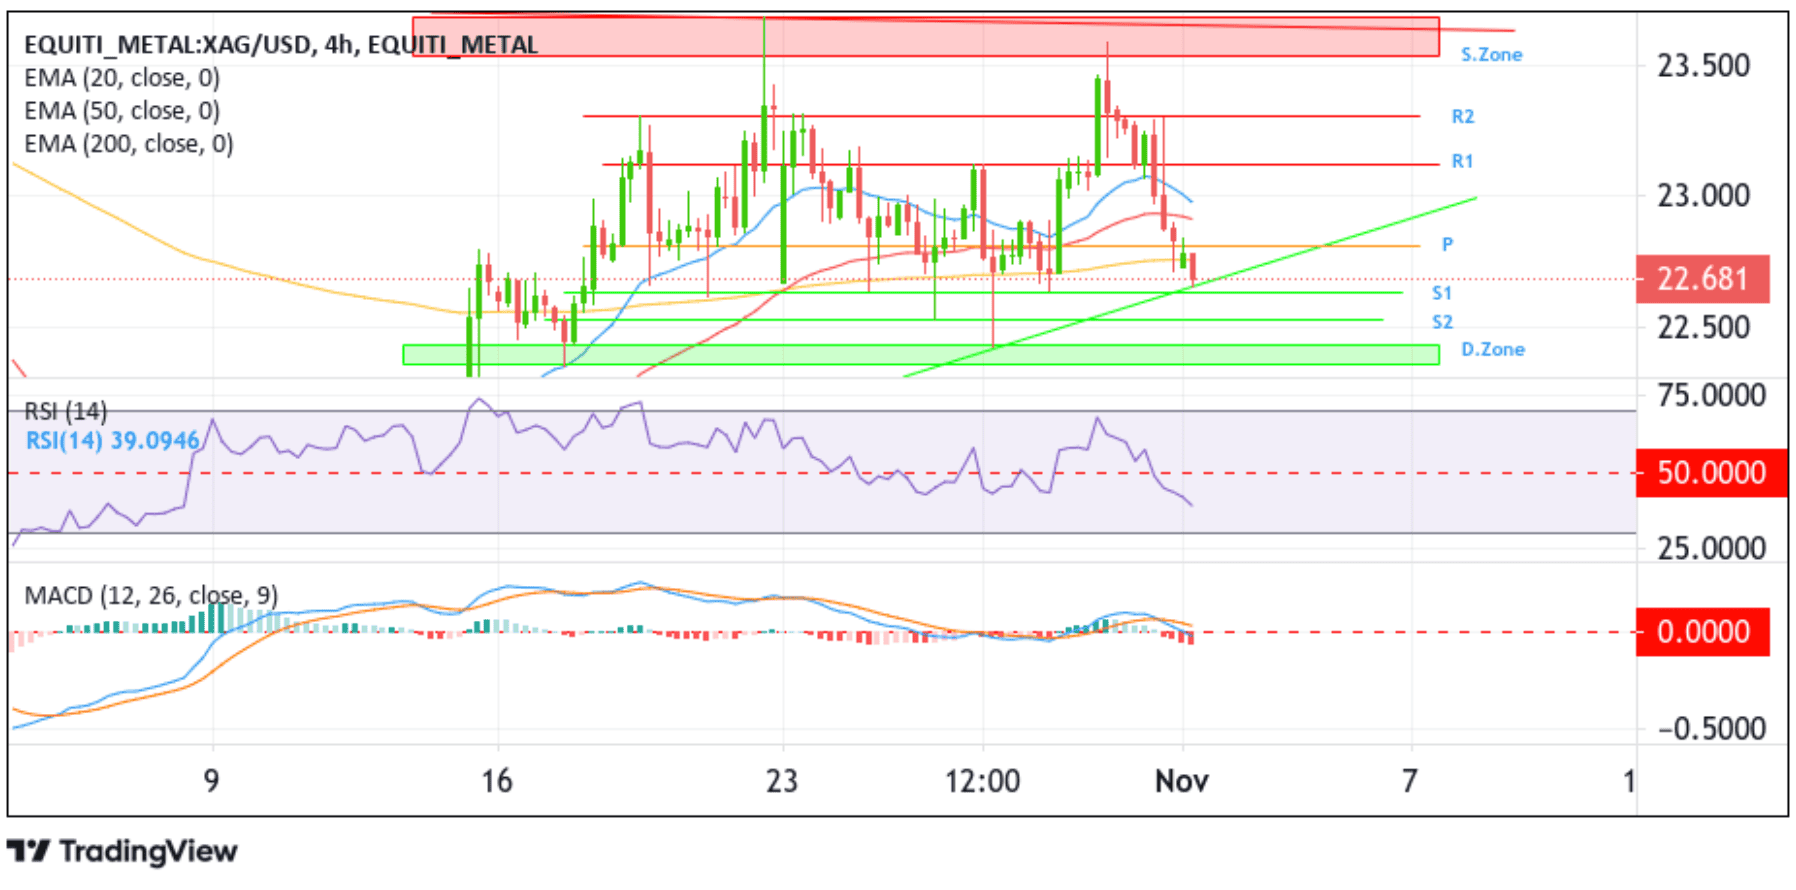
Technical Outlook: Four-Hour Silver Price Chart

From a technical perspective, the price of the precious grey metal is currently trading at $22.681 per ounce after bears heeded the call to Short the precious commodity after receiving confirmation of the price’s acceptance below the technically strong 200-day (yellow) Exponential Moving Average (EMA) at 22.754 level. Some follow-through selling would drag spot prices back toward retesting the key support level plotted by an ascending trendline extending from the late-October 2023 swing low. A clean break (bearish price breakout) below this support level will reaffirm the bearish bias and pave the way for a move toward the 22.634 support level (S1). If sellers manage to breach this floor, silver could drop toward the 22.528 support level (S2). On further weakness, silver could accelerate its decline toward the demand zone ranging from 22.425 to 22.344. Sustained weakness below this zone will pave the way for dip losses around the XAG/USD pair.
The Relative Strength Index (RSI 14) technical oscillator on the chart is in dip-negative territory, suggesting continuing the bearish price action this week. The Moving Average Convergence Divergence (MACD) technical oscillator, on the other hand, is on the verge of moving below the signal line. If this happens in the coming sessions, it will add credence to the bearish outlook. Nevertheless, the bullish outlook is firmly supported by the acceptance of the price below the technically strong 200-day (yellow) Exponential Moving Average (EMA) at the 22.754 level.
On the flip side, if buyers resurface and spark a bullish turnaround, initial resistance comes in at 22.634. A convincing move above this barricade would negate the bearish outlook and pave the way for aggressive technical buying. Silver could then ascend toward the 22.879 pivot level, about which, if the price pierces this barrier, silver could rally to tag the 50 (red) and 20 (blue) days EMA levels at 22.588 & 22.936 levels, respectively, before ascending toward the 23.119 resistance level (R1). A clean move above this level will pave the way for a move toward the 23.311 resistance level (R2), and in highly bullish cases, silver could extend a leg up toward the October 2023 swing high resistance level at the 23.700 level.


