NZD/USD Weakens Below 0.59000 Mark On Softer NZ CPI Data


Key Takeaways:
- The NZD/USD pair met fresh supply during the early-Asian session, weighed by softer NZ CPI data
- Hawkish Fed market expectations support elevated U.S. Treasury yields, which underpin the greenback
- Dovish RBNZ expectations and downbeat Chinese macro data weigh on the Kiwi
- Investors look forward to the release of the U.S. Retail Sales data for fresh NZD/USD directional impetus
The NZD/USD cross witnessed renewed selling on Tuesday and dropped below the 0.59000 mark during the first half of the Asian session, supported by fresh U.S. dollar buying on Tuesday. Rising U.S. Treasury bond yields, bolstered by hawkish Fed expectations, were a key factor that supported the greenback and kept a lid on the pair against any further uptick. The market seems convinced that the Federal Reserve (Fed) will raise interest rates during its November or December meeting.
It is worth recalling that several FED officials reiterated the need to lift interest rates in the upcoming FED policy meetings in November or December, which supports elevated U.S. Treasury yields and acts as a tailwind for the greenback. Investors now expect a high chance of a 25 basis points (bps) rate hike in either of the two upcoming policy meetings after a slew of U.S. economic data released early this month pointed to a further growing need for a rate hike by the Fed in November or December.

Additionally, a surprisingly hot reading in September's consumer price index and producer price index reports indicated an increasingly complex pathway to bring down inflation by the Federal Reserve.
Further contributing to the sentiment surrounding the NZD/USD cross was the better-than-expected Statistics New Zealand inflation data report released earlier today, which showed the annual inflation rate in New Zealand eased to 5.6% in the September quarter of 2023 from 6% in the second quarter. It was the lowest figure since the third quarter of 2021. Every quarter, the consumer price index increased 1.8% in the third quarter, accelerating from a 1.1% increase in the preceding quarter. To a greater extent, the data cements market expectations that the Reserve Bank of New Zealand (RBNZ) will leave its official cash rate (OCR) unchanged during its November Monetary Policy meeting, which weighs on the Kiwi.
Further weighing on the Kiwi is the slew of downbeat Chinese macro data released last week, which weighed on the Yuan and contributed to its general weakness against a basket of currencies. To counter the Yuan's weakness, the PBoC has continued to set USD-CNY daily fixings that are much lower than what would be implied by the fixing formula. However, on Monday, the People's Bank of China (PBoC) set the USD/CNY central rate for the trading session ahead at 7.1798 as compared to the previous day's fix of 7.1775 and 7.3121, according to a Reuters estimate.
As we advance, investors look forward to the U.S. docket featuring the release of the Retail and Core Retail Sales (MoM) (Sep) data report. Investors will look for cues from China's Q3 GDP report and the PBoC Loan Prime Rate announcement, set for release on Wednesday and Thursday, respectively.
Technical Outlook: Four-Hour NZD/USD Price Chart
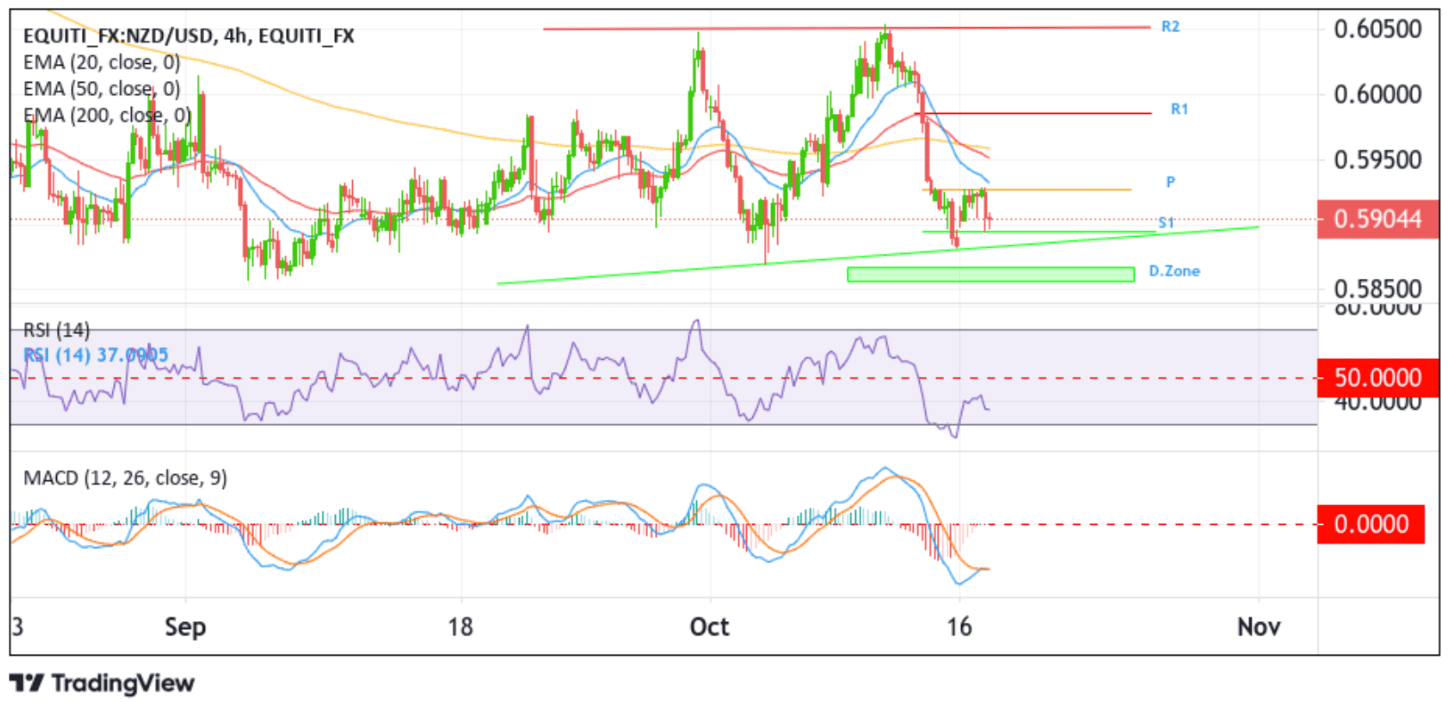
From a technical perspective, the NZD/USD pair is holding below the 0.59272 level, which acts as a pivot level (P). That said, a further increase in selling momentum from the current price level will drag spot prices toward the immediate support level at 0.58946 (S1). On further weakness, the NZD/USD pair would drop toward the key support level plotted by an ascending trendline extending from the early October 2023 swing low. A subsequent break below this level would reaffirm the bearish thesis and act as a fresh trigger for new sellers to join and push down the price. The downward trajectory could then be extended toward the demand zone, ranging from 0.58674 - 0.58569 levels. Sustained weakness below this zone would pave the way for more profound losses around the shared currency.
On the other hand, if buyers resurface and spark a bullish turnaround, initial resistance comes in at the 0.59272 pivotal level. If bulls manage to break above this barricade convincingly, the NZD/USD pair could rally toward tagging the 50-day (red) and 200-day (yellow) Exponential Moving Average (EMA) at 0.59491 and 0.59580 levels, respectively. A convincing move above these levels would set the shared currency for a further rally toward confronting the 0.59859 resistance level (R1). In extremely bullish cases, the NZD/USD rally could be extended toward the 0.60552 resistance level (R2).