Gold Snaps Three-Day Winning Streak And Retreats Back Below 1932.00 Mark; Fed's Decision Awaited


Key Takeaways:
- Gold price snaps a three-day winning streak weighed by a combination of factors
- The prevalent cautious mood has seen investors shy away from riskier assets and flock to traditional safe-haven assets, benefiting the buck
- A Fed September pause plus recovery in demand in China might help limit further losses around the gold price
- Market focus remains on the Fed's decision; a rate hike pause is entirely expected

Gold (XAU/USD) struggled to capitalize on the modest bounce from the 1923.832 level or weekly low, touched on Monday and attracted fresh selling on Tuesday during the Asian session. The precious yellow metal is trading at $1932.30, posting a 0.07% daily loss, and has snapped a three-day winning streak amid fresh U.S. dollar demand.
A combination of factors assisted the U.S. Dollar Index (DXY), which measures the greenback against a basket of currencies, in attracting some intraday buying on Tuesday, just above the 105.000 mark, and saw it rise modestly to register a 0.08% daily gain, which in turn was seen as a key factor that helped limit further improvements for the XAU/USD cross. Apart from this, investors have shied away from riskier assets and flocked to traditional safe-haven assets ahead of the release of the key Fed interest rate decision on Wednesday, which benefitted the greenback and helped cap the upside for the XAU/USD pair.
That said, the Federal Reserve (Fed) is set to start its two-day Monetary Policy meeting today and is widely expected to announce later on Wednesday it has left its Fed Funds rate unchanged at 5.25%, which in turn would weigh on the buck and warrant caution for investors against placing aggressive bullish bets around the XAU/USD cross. This, combined with the recovery in demand in China, supported by a fresh stimulus package from the Central Bank of China, might help limit further losses around the bullion price.
Additionally, this comes after a U.S. inflation data report released last week by the U.S. Bureau of Labor Statistics (BLS) showed the annual core consumer price inflation rate in the United States, which excludes volatile items such as food and energy, fell to its lowest level in two years. Additionally, supporting the case for a September pause was another U.S. BLS report released early this month that indicated a gradual easing of labor market conditions.
Despite that, market investors are still pricing that the Federal Reserve (Fed) will lift interest rates by 25 basis points (bps) before the end of this year, which in turn remains supportive of the greenback. Recent data showed the U.S. economy continued to display remarkable resilience, cementing the odds for a final 25 bps Fed rate hike before 2024.
As we advance, Market Participants now look forward to second-tier U.S. economic data, which will influence the USD and the broader market risk sentiment. The main focus, however, remains on the release of the Fed Interest Rate Decision on Wednesday during the mid-North American session. Investors will keenly follow the FOMC statement that will accompany the Fed Interest Rate Decision and listen attentively to the question-and-answer segment with the Fed Chair, Powell, during the FOMC press conference to see how hawkish/dovish the language is around inflation and future monetary policies.
Technical Outlook: Four-Hours Gold Price Chart
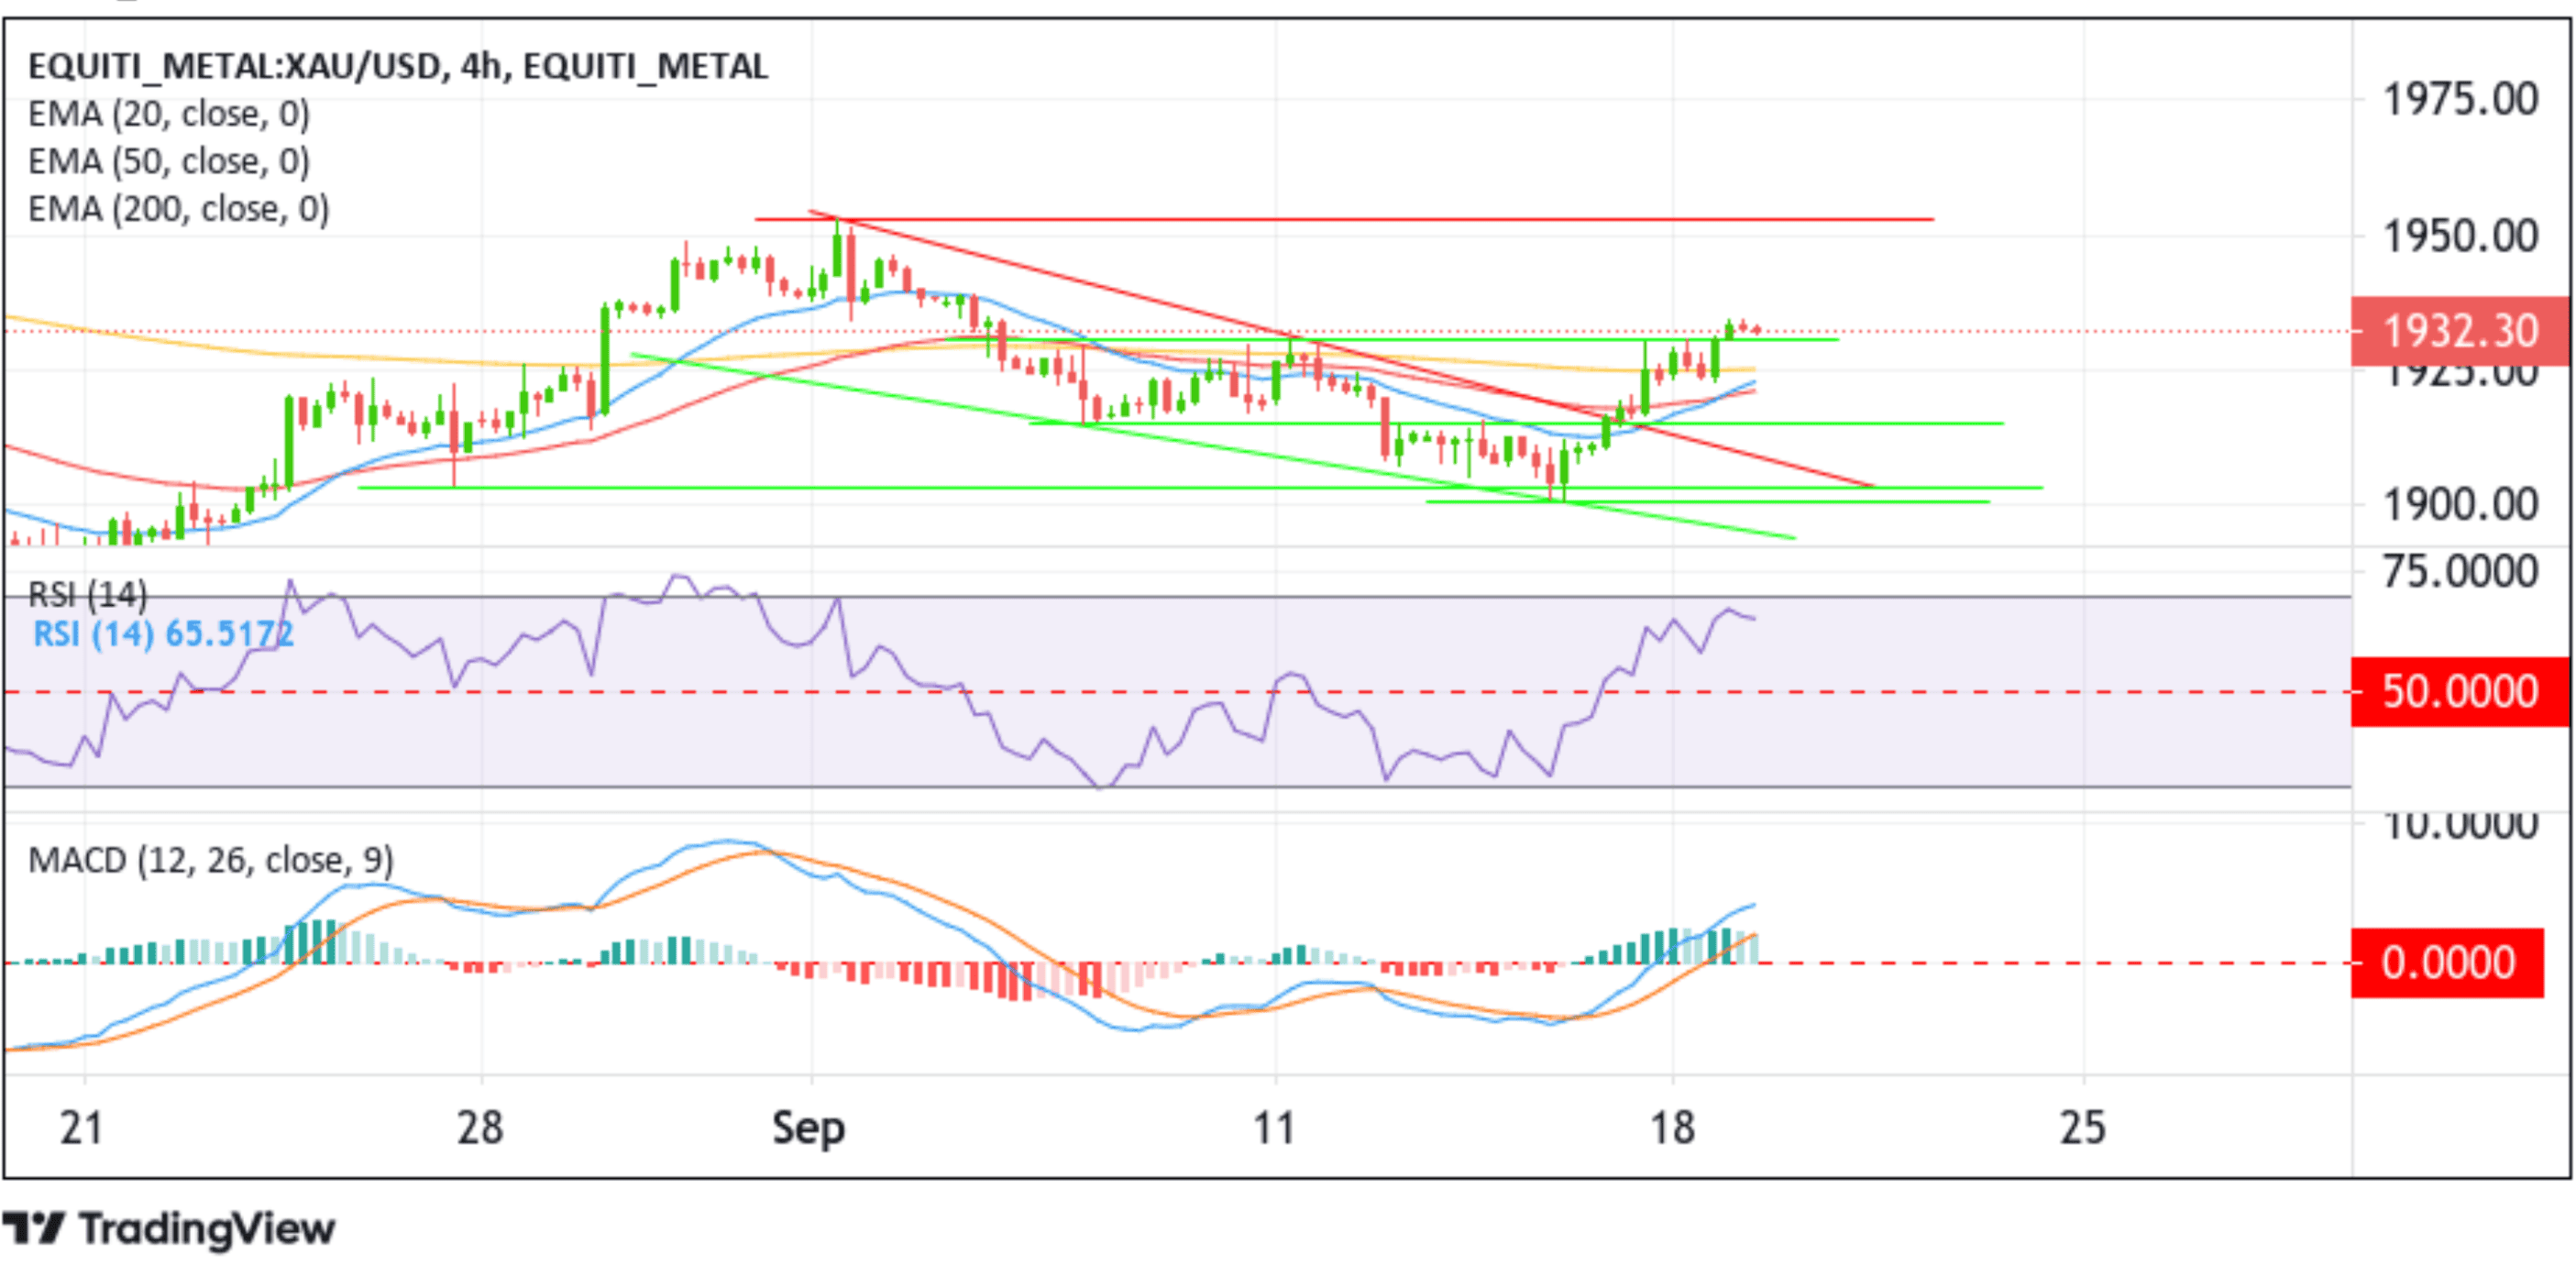
From a technical standpoint, bulls managed to push the price further up after breaking above the cluster resistance level displayed by a downward-sloping trendline and further after finding acceptance above the technically strong 200-day (yellow) Exponential Moving Average (EMA) at the 1924.98 level. As of press time, the price has rebounded from the vicinity of the 1934.48 level after attracting fresh selling during the Asian session, and if sellers increase their selling pressure, the XAU/USD price could drop to confront the 200-day (yellow) EMA level. A convincing move below this strong barricade would cause gold prices to weaken further toward the buyer congestion zone due to the 20 (blue) and 50 (red) day EMA levels at the 1923.68 and 1921.64 levels, respectively. If side-lined sellers join in from this zone, it will rejuvenate the bearish momentum, provoking an extended decline toward the 1915.04 key support level. If sellers manage to breach this floor, downside pressure could accelerate further, paving the way for a slide toward the cluster resistance level turned support level displayed by a downward-sloping trendline. A subsequent break below this support level will pave the way for a move toward the 1903.27 level en-route to the 1900.86 key support level.
On the flip side, if buyers return and catalyze a bullish reversal, initial resistance is seen at the 1934.48 level. A breach above this resistance level will extend the bullish trajectory toward the 1953.06 key resistance level (September 2023 swing high level).
