GBP/USD Seems Vulnerable Near Key Support Channel; Incoming Positive U.S. Data Might Trigger A Bearish Price Breakout


Key Takeaways:
- GBP/USD witnessed renewed selling and dropped near a key support channel
- A fresh leg-up in U.S. Treasury bond yields and upbeat U.S. macro data offered some support to the greenback, helping cap the upside for the GBP/USD for the time being
- Softer U.K. inflation prints might force the Bank of England (BoE) to consider cutting rate hikes in 2024, which acts as a headwind to the cable
- Investors look ahead to the release of the U.S. quarter-three GDP report for fresh GBP/USD directional impetus
The GBP/USD cross came under renewed selling pressure on Thursday during the mid-Asian session and eased further from a one-week high/1.27619 level touched on Tuesday. The pair trades at 1.26635, posting a 0.07% daily loss, and sits directly above a key support channel. The shared currency looks set to maintain its offered tone heading into the European session amid the prevalent style surrounding the greenback.
A fresh leg-up in U.S. Treasury bond yields offered some support to the greenback and turned out to be a key factor that weighed on the GBP/USD pair. Apart from this, a modest rebound in the equity markets also turned out to be another factor acting as a tailwind for the safe-haven greenback and undermining the Great British Pound (GBP).
Moreover, the greenback continues to be supported by a fresh batch of positive U.S. macro data released on Wednesday. The December consumer confidence survey came in stronger than expected, rising to 110.7 from the downwardly revised 101 a month earlier, the Conference Board said. That’s above the 104.5 expected by economists polled by Dow Jones.

Additionally, sales of previously owned homes in the United States went up 0.8% month-over-month to a seasonally adjusted annualized rate of 3.82 million units in November 2023, rising for the first time in five months and rebounding from 3.79 million in October, which was the lowest level since August 2010. Figures came above forecasts of 3.77 million, benefiting from a fall in mortgage rates.
Further supporting the greenback is the upcoming data, which shows the U.S. economy expanded by 5.2% in the third quarter of 2023, up from 2.1% in the second quarter of this year.
Shifting to the U.K. docket, a U.K. Office for National Statistics (ONS) report released on Wednesday showed the annual inflation rate in the U.K. slowed to 3.9% in November 2023, the lowest since September 2021, from 4.6% in October and well below forecasts of 4.4%. The inflation rate in the U.K. slowed to 0.2% in November 2023, marking the first fall in four months following a flat reading in October and compared to market forecasts of a 0.1% rise.
Excluding food and energy, the annual inflation rate in the U.K. declined for a fourth consecutive month to 5.1% in November 2023, the lowest since January 2022, from 5.7% in October and well below forecasts of 5.6%. Every month, consumer prices in the United Kingdom decreased by 0.3% in November 2023, the first decline since January, compared to forecasts of a 0.2% rise.
That said, the better-than-expected U.K. inflation data report might force the Bank of England (BoE) to consider cutting rate hikes in 2024, which acts as a headwind to the cable.
Despite the supporting factors, the greenback continues to be weighed down by firm market expectations that the U.S. Federal Reserve will soon begin cutting interest rates as the Fed aims to win its battle against stubborn inflation in the U.S.
Markets seem convinced the Fed will start cutting rates soon after Fed Chair Jerome Powell, during the December Fed Press Conference last week, said three rate cuts were coming in 2024. CME’s Fed Watch tool shows Fed fund futures traders have priced in rate cuts to start as early as March 2024.
As we advance, investors look forward to the U.S. docket featuring the release of the GDP (QoQ) (Q3) data report for fresh directional impetus. Traders will further look for cues from the release of the Philadelphia Fed Manufacturing Index (Dec) and the Initial Jobless Claims (previous week) data reports.
Technical Outlook: Four-Hours GBP/USD Price Analysis
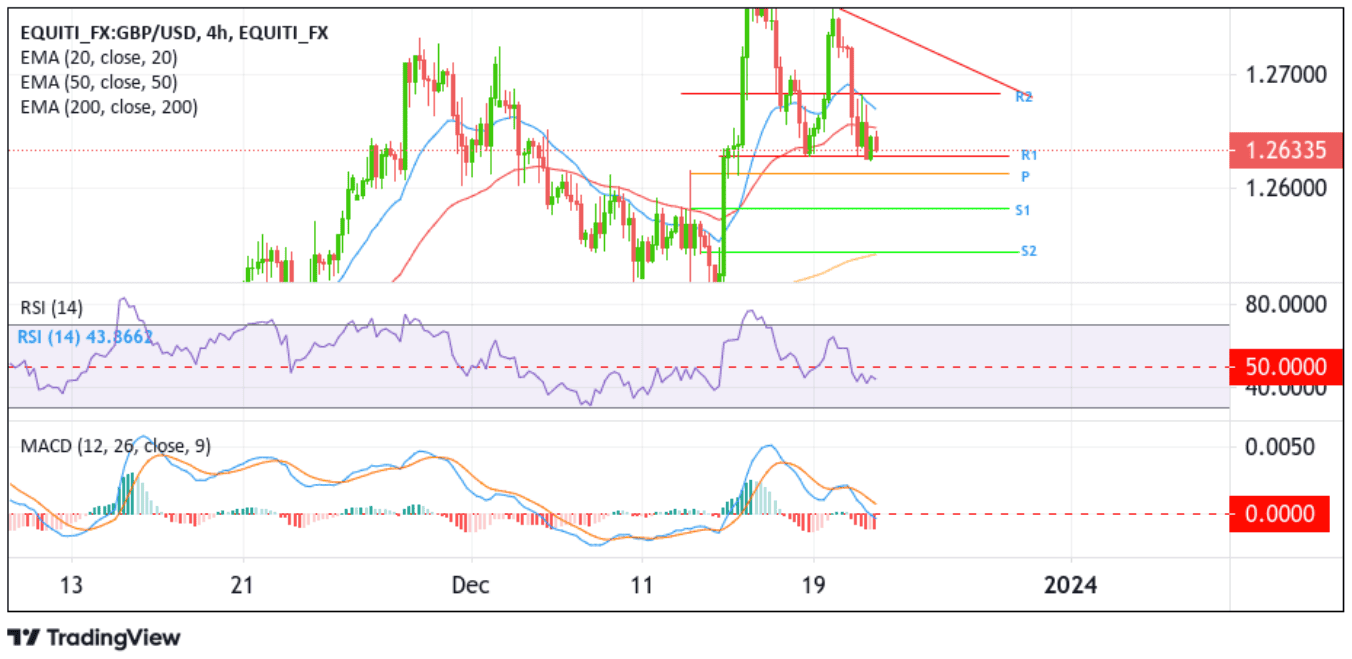
From a technical standstill, GBP/USD has been trading with a bullish bias for the past week and is currently placed just above the horizontal support channel of the descending triangle chart pattern. A further increase in selling pressure in the coming sessions, followed by a decisive break below the aforementioned support level, would trigger an increase in downside momentum, paving the way for a decline toward the pivot level (p) at 1.26108. If sellers manage to breach this floor, downside pressure could accelerate, paving the way for a drop towards 1.25822 (S2). On further weakness, the focus shifts towards the 1.25423 support level (S3), coinciding with the technically strong 200-day Exponential Moving Average (EMA).
On the flip side, if buyers resurface and spark a bullish turnaround, initial resistance comes in at 1.26789 (R1). On further strength, the focus shifts higher toward the key resistance level (downward-sloping trendline of the descending triangle chart pattern). A subsequent break above this resistance level would act as a fresh trigger for new buyers to jump in, paving the way for additional gains around the GBP/USD cross.
