GBP/USD Moves Back Below $1.26880 On Disappointing UK BRC Retail Sales Data, UK & US PMIs Data Awaited


Key Takeaways:
- The Great British Pound (GBP) depreciated below $1.26880, moving away from a two-week high on Tuesday during the mid-Asian session
- The weaker-than-expected UK BRC retail sales data weighs heavily on the cable and helps cap the upside for the GBP/USD cross
- A goodish pickup in U.S. Treasury bond yields supported by firm hawkish Fed expectations extend support to the buck
- Investors look forward to the release of U.K. and U.S. services and composite PMI data reports
The Great British Pound (GBP) depreciated below $1.26880, moving away from a two-week high on Tuesday during the mid-Asian session as investors digested the latest UK BRC retail sales data and its potential impact on the Bank of England's policy trajectory.
A British Retail Consortium (BRC) report released earlier today showed retail sales in the United Kingdom rose 1.0% in February 2024 from a year ago, slowing from a 1.4% gain in January and coming in way below market consensus for a 1.5% gain. According to the BRC report, the drop in consumer consumption in February is attributed to bad weather and persistent cost-of-living pressures.

The weaker-than-expected UK BRC retail sales data, which helps analysts gauge the health of the economy and any inflation pressures that exist, dampened the market mood and saw investors reprice their bets for early rate cuts, with the first-rate cut seen as early as June rather than August.
The dampened market mood has seen investors double up in taking their profits off the table, helping reverse solid gains from a two-day rally inspired by positive signals from the Bank of England's (BoE) monetary policy indicators combined with the recent hawkish comments by BoE officials.
Noteworthy, data last week showed that net mortgage approvals for house purchases in the United Kingdom, an indicator of future borrowing, rose to 55.2 thousand in January 2024 from 51.5 thousand in the previous month, exceeding market expectations of 52.0 thousand.
Additionally, individuals in the United Kingdom repaid, on net, £1.1 billion of mortgage debt in January 2024, compared to £0.9 billion in December, falling short of the market consensus for £0.2 billion in net lending.
Moreover, the cable was supported by the hawkish comments by the Bank of England's (BoE) chief economist Huw Pill on Friday, who, during a presentation at Cardiff University Business School, said, "While that persistent component of inflation continues to threaten the lasting and sustainable achievement of the 2% inflation target, the MPC will need to maintain a degree of restrictiveness in its monetary policy stance to squeeze this persistent component out of the system".

That said, a goodish pickup in U.S. Treasury bond yields supported by firming expectations that the Fed will leave rates unchanged during the March and May meetings and start cutting rates during the third quarter of 2024 helped revive U.S. dollar demand and turned out to be another key factor that helped exert downward pressure on the GBP/USD cross.
Apart from this, the modest bounce in the U.S. equity markets further extends support for the greenback and helps pave the way for further selling around the GBP/USD cross.
Investors look forward to releasing U.K. and U.S. services and composite PMI data reports as we advance, which will help determine the next leg of a directional move for the GBP/USD pair. The main focus, however, remains on Fed Chair Powell's testimony before the Joint Economic Committee in Washington, DC, on Wednesday and the release of the U.S. monthly jobs data report- popularly known as the Non-Farm Payrolls (NFP) report, on Friday.
Technical Outlook: Four-Hour GBP/USD Price Chart
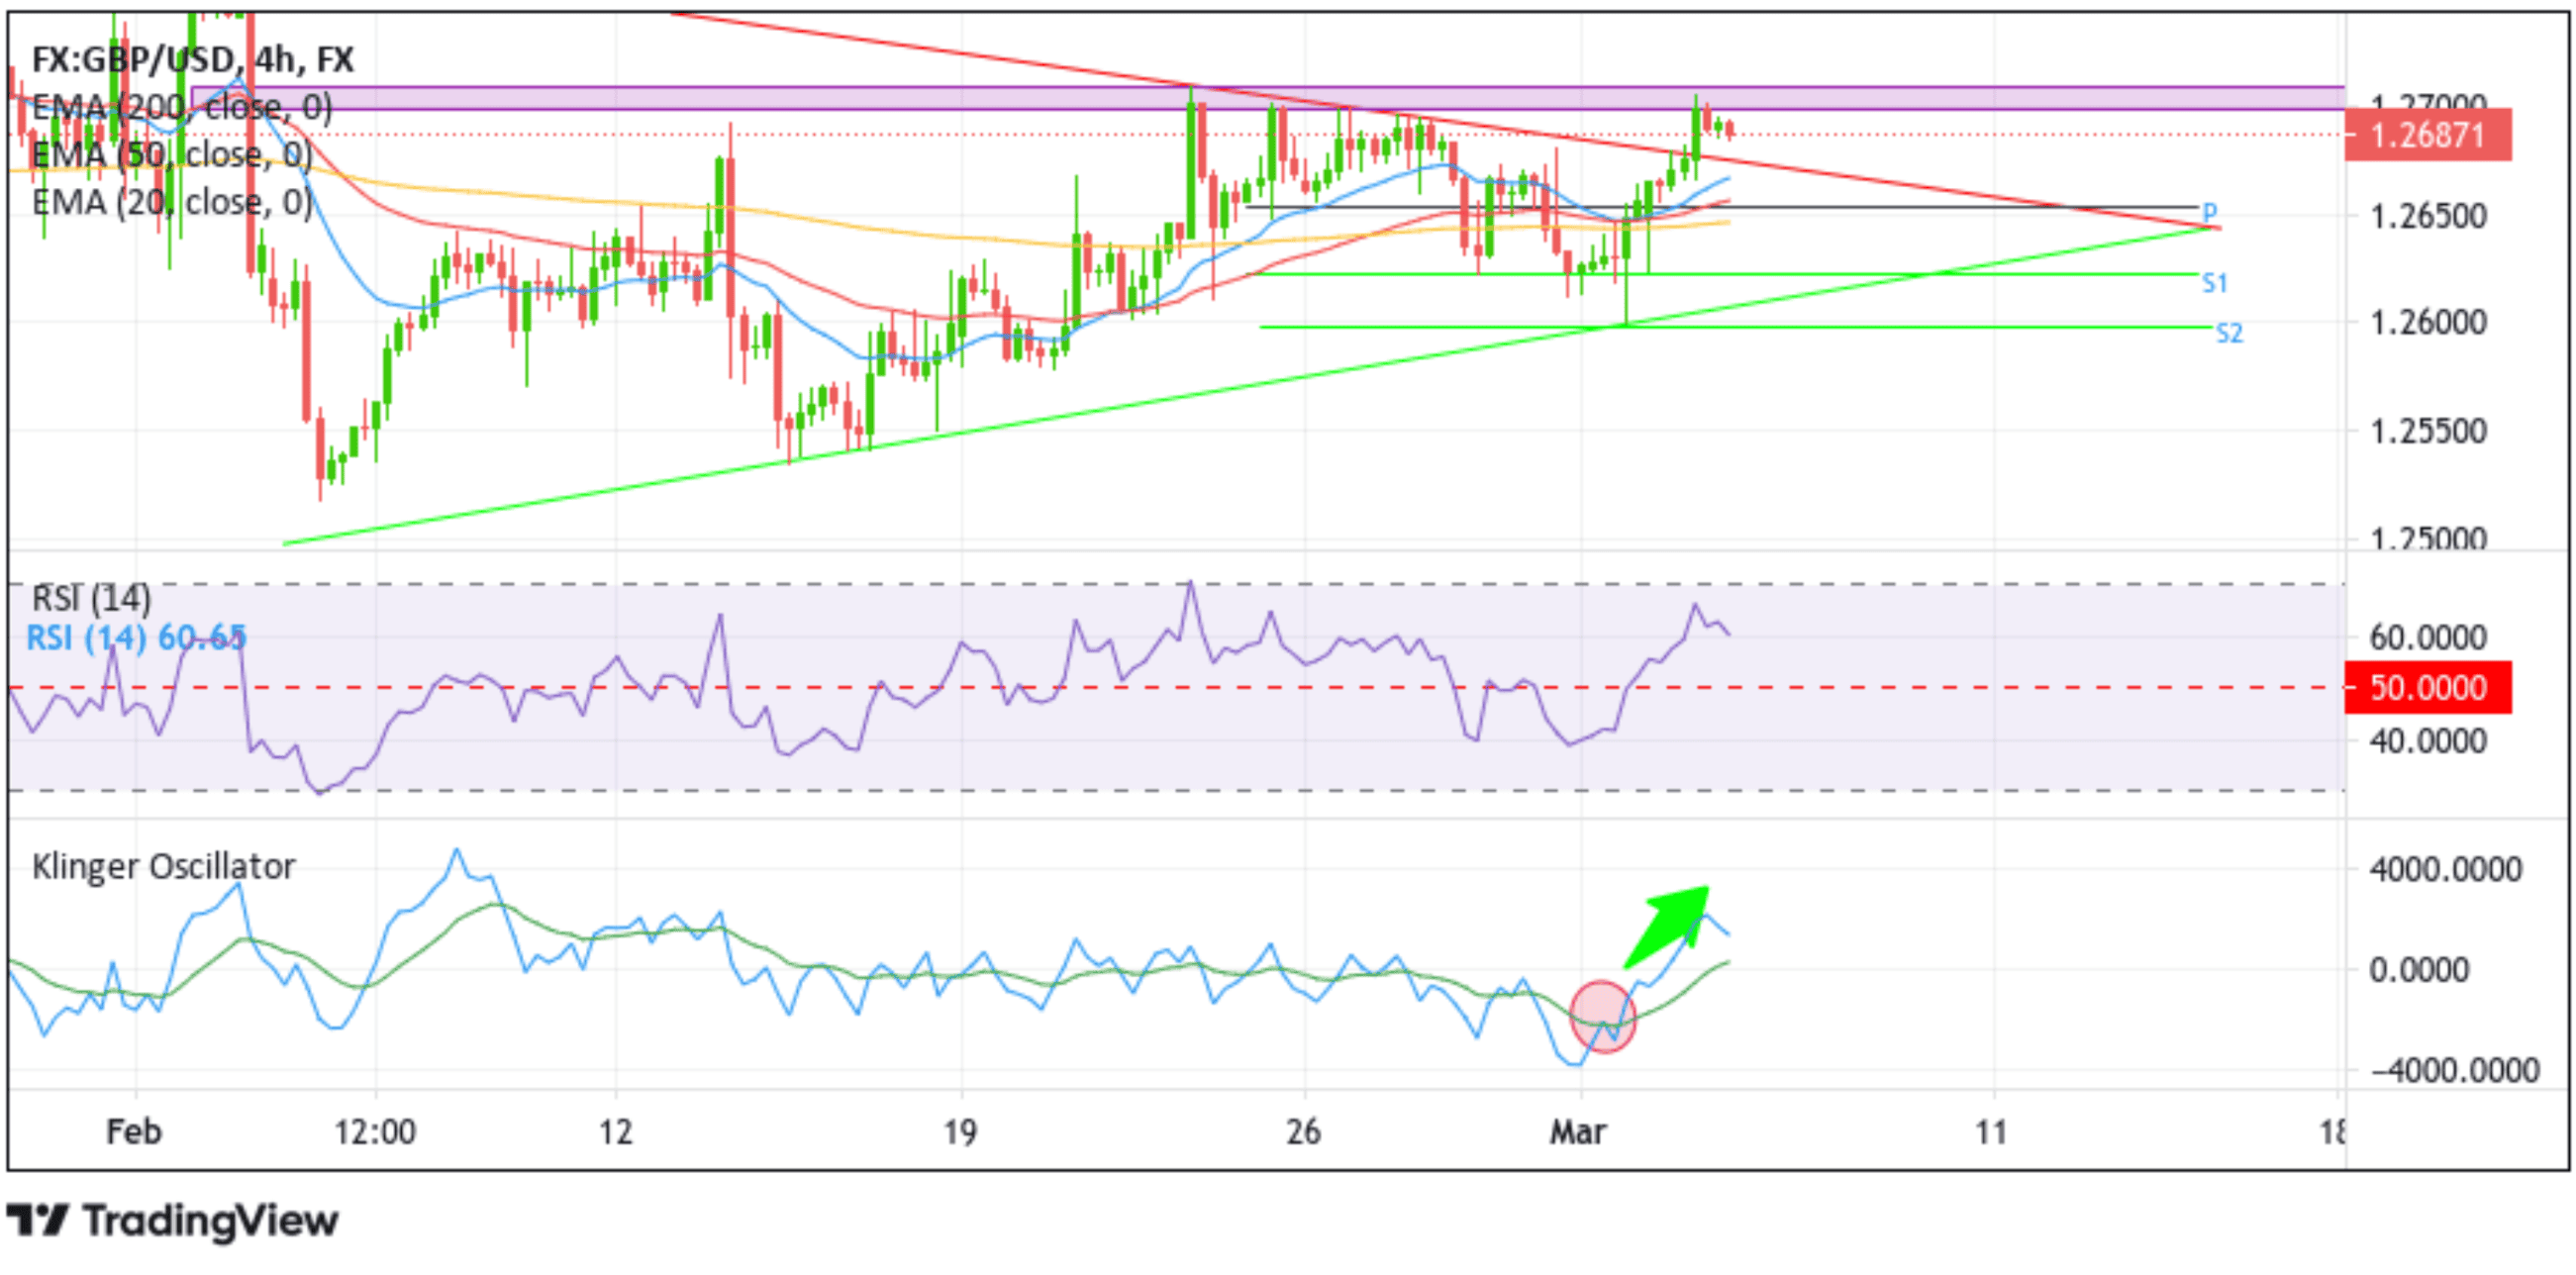
Looking at the four-hour price chart above, the GBP/USD price had been trading within a bullish symmetrical chart pattern, a popular bullish continuation chart pattern, for the past four weeks before eventually breaking above the upper limit of the pattern on Monday. Bulls, after that, tried to push the GBP price further above the supply zone, ranging from $1.27091 to $1.26979, but they could not hold the higher levels. Afterwards, bears retook market control, forcing a bearish reversal toward $1.26880. The overhead resistance is displayed by the key resistance level (upper limit of the pattern) now turned supported level, and below it lies the seller congestion zone due to the 20 (blue), 50 (red), and 200-day (yellow) Exponential Moving Average (EMA) levels.
Moreover, all the technical oscillators (RSI (14) and Klinger) on the chart display a bullish outlook and support the case for further continuation of the bullish price action this week. Notably, the Klinger oscillator on the chart shows the Klinger line has crossed above the signal line, indicating a bullish trend. In contrast, the Relative Strength Indicator (RSI) 14 oscillator at 60.65 is in dip positive territory and adds credence to the bullish bias.
On the flip side, a four-hour candlestick close below the aforementioned resistance level now turned support level, followed by acceptance below the seller congestion zone, will negate the bullish outlook, paving the way for a fall toward the 1.2623 level (S1). A decisive move below this level could see the GBP/USD price stretch further downward toward the lower limit of the pattern. A subsequent break below this key support level would turn the GBP/USD vulnerable for a drop toward the $1.25984 level, followed by $1.25727, and in extreme bearish cases, the GBP/USD could extend a leg down toward the $1.25003 support level.