FRA 40 Futures Index Rebounds From Two-Months High And Moves Back Below €7200.00 Mark; Further Downtick Seems Elusive



Key Takeaways:
- The CAC 40 (FRA40) futures index rebounded during the early Asian session on Friday and moved back below the €7200.00 mark
- The main index is under heavy bullish pressure, and any further selling could still be seen as a buying opportunity
- October's ECB meeting minutes and better-than-expected HCOB Eurozone Composite PMI remain supportive of the main index despite the pullback
- Eurofins Scientific SE, Plc. (Paris: EUFI) and Teleperformance S.E., Plc. (Paris: TEPRF) led the list of top gainers and losers in the current trading session

The CAC 40 (FRA40) futures index edged slightly lower on Friday during the Asian session as investors continued to digest minutes of the European Central Bank's (ECB) October monetary policy meeting and the latest Eurozone PMI readings.
As of press time, futures tied to France's main stock index (FRA40) fell 0.05% (3.84 points) to trade at the €7268.85 level, just a few pips from the two-month high/7274.41 level touched on Thursday following a modest rise inspired by the latest ECB meeting minutes and eurozone PMI readings.
The minutes of the European Central Bank's (ECB) October monetary policy meeting released on Thursday showed policymakers were cautiously optimistic about the economy and inflation falling in the Eurozone. In fact, concerning inflation, the minutes said, "Inflation expectations reported in the ECB Survey of Professional Forecasters had remained broadly unchanged in October. Most of the distribution had remained concentrated around 2%. The ECB Consumer Expectations Survey showed that consumers had not yet adjusted downwards their perception of past inflation".
Concerning October's monetary policy decision and future monetary policy stance and policy considerations, the minutes said, "Members agreed that the Governing Council should continue to stress its determination to set policy rates, through its future decisions, at sufficiently restrictive levels for as long as necessary to bring inflation back to target in a timely manner. In view of the high uncertainty and the risk that further supply shocks could materialize, the Governing Council's data-dependent approach was also reaffirmed. Even if interest rates were left unchanged at the current meeting, the view was held that the Governing Council should be ready, on the basis of an ongoing assessment, for further interest rate hikes if necessary, even if this was not part of the current baseline scenario".
Further supporting the FRA40 Index rally on Thursday was the S&P global report, which showed the HCOB Eurozone Composite PMI rose to 47.1 in November 2023, up from a near three-year low of 46.5 in the previous month and slightly above market expectations of 46.9. The latest reading still indicated a sixth month of reduced business activity, albeit at a decelerated pace, with both services and manufacturing sectors showing slower contraction rates during this period.
E.U. 50 Stoxx Index Movers
Here are the top FRA40 index movers today before the bell, a week in which the primary index is set to close with heavy gains.
Top Gainers
- Eurofins Scientific SE, Plc. (Paris: EUFI) rose 1.78%/0.92 points to trade at €52.70 per share.
- Total Energies SE, Plc. (Paris: TTEF) added 1.55%/0.96 points to trade at €62.81 per share.
- Sanofi, Plc. (Paris: SASY) gained 1.55%/1.32 points to trade at €86.24 per share.
Top Losers
- Teleperformance S.E., Plc. (Paris: TEPRF) lost 1.07%/1.40 points to trade at €130.05 per share.
- Alstom S.A., Inc. (Paris: ALSO) declined 1.00%/0.13 points to trade at €12.33 per share.
- Worldline S.A., Inc. (Paris: WLN) shed 0.91%/0.13 points to trade at €13.55 per share.
As we advance, market participants now look forward to second-tier eurozone economic data, which will influence the euro and provide FRA40 Index directional impetus, along with the broader market risk sentiment.
Technical Outlook: One-Day FRA40 Index Price Chart
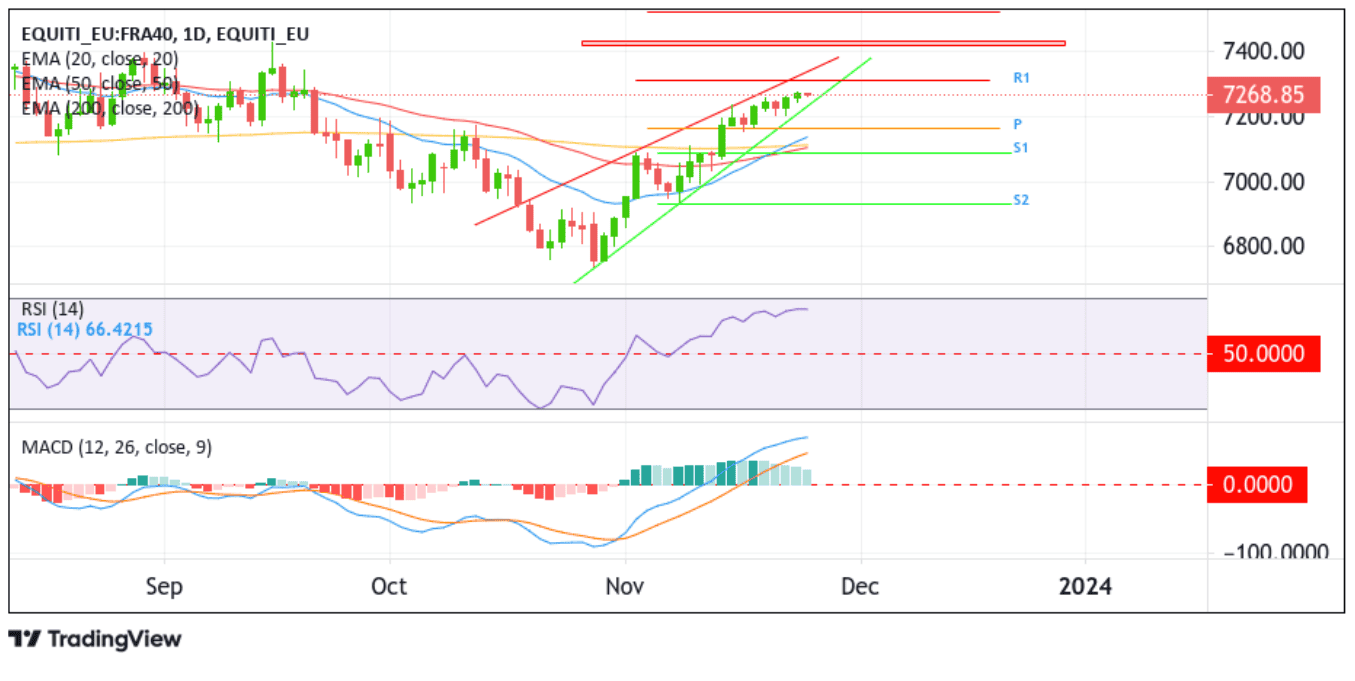
From a technical standpoint, November 14's convincing move above the technically strong 200-day (brown) Exponential Moving Average at the 7110.69 level and the subsequent move above the key pivot level (p), which corresponds to the 61.8% Fibonacci retracement level (Golden Fib) at the 7161.62 level, favored Bulls and supported the case for further upside moves. Apart from this, all the technical oscillators (RSI(14) and MACD) on the chart are in the dip-bullish territory, suggesting the continuation of the bullish price action and the current downtick chances of fizzling out sooner or later.
If dip-buyers resurface and spark a bullish turnaround, initial resistance comes in at the 7318.48 level. If the price pierces this ceiling, buying interest could gain further momentum, paving the way for an ascent toward the 7454.51 - 7422.33 supply zone. Sustained strength above this zone could see the main index extend its bullish trajectory toward the 7519.11 ceiling, and in dire cases, the main index could extend a neck up toward the 2023 record high at the 7599.36 level.
