NZD/USD Extends NFP Inspired-Gains Above 0.61900s Amid Sustained USD Selling, US CPI Data Eyed


- NZD/USD cross witnessed aggressive bullish bets during the early Asian session and moved higher above 0.61900s
- Declining treasury bond yields, along with a positive risk tone around the U.S. equity markets, undermined the greenback
- Payrolls rose by 311,000 in February, more than expected, but wage growth fell further as unemployment remained high, BLS reported on Friday
- New Zealand Factory Activity Expanded for the second month, according to an N.Z. Business PMI report, in turn, underpins the Kiwi and exerts upward pressure on the NZD/USD pair
- Markets focus shifts to the key U.S. inflation data set for release tomorrow for fresh directional impetus

NZD/USD pair attracted some dip-buying from the vicinity of 0.63160 levels during the early-Asian session and gained positive traction for the second consecutive day. The cross so far has managed to extend the modest rebound from the monthly low/0.60841 level and was last seen trading firmly above 0.61900s. Declining treasury bond yields and a positive risk tone around the U.S. equity markets undermined the greenback and helped exert upward pressure on the NZD/USD pair. Apart from this, the shutdown of Silicon Valley Bank sparked a flight to safer assets, such as government bonds, which saw the treasury bond yields fall sharply.
The U.S. Dollar index (DXY), which measures the value of the United States dollar relative to a basket of foreign currencies, was down 0.84% on Monday at $103.778, extending its corrective slide from the vicinity of $105.862 after the latest data on Friday showed labor data for February showed slower wage growth, suggesting an easing of inflation pressures which may keep the Federal Reserve's pace of interest rate hikes modest.
The U.S. economy unexpectedly created 311K jobs in February of 2023, well above market forecasts of 205K. Following a downwardly revised 504K in January, the U.S. Bureau of Labor Statistics reported on Friday. Average hourly earnings, on the other hand, for all employees on U.S. private nonfarm payrolls rose by 8 cents, or 0.2%, to $33.09 in February 2023, while markets had expected them to remain at 0.3%, marking the smallest growth in average hourly earnings in a year. On a year-to-year basis, average hourly earnings increased by 4.6%, up from 4.4% in the prior month but slightly below market forecasts of a 4.7% rise.
Additionally, the unemployment rate rose to 3.6%, above the expectation for 3.4% in February, amid a tick higher in the labor force participation rate to 62.5%, its highest level since March 2020. Commenting on the mixed data report, "Mixed is an apt descriptor. There's something for everybody in there," said Liz Ann Sonders, Chief Investment Strategist at Charles Schwab. "We're still in a recession for certain parts of the economy."
That said, Fed fund futures traders have now priced in a 41% chance of a 50 bps hike when Fed policymakers meet on March 22, compared with a 71.6% probability a week ago. The market got ahead of itself on the prospect of a 50 basis-point hike at the next Fed meeting, said Dec Mullarkey, Managing Director of investment strategy and asset location at SLC Management in Boston.
Dec's comments were about investors pricing in a 50 bps interest rate hike after Fed Chairman Jerome Powell last week told Congress that current metrics show inflation is back on the rise. If that continues to be the case, he expects rates to increase to a higher level than previously expected. Powell specifically noted the "extremely tight" labor market as a reason why rates are likely to continue rising and stay elevated. He also indicated that the increases could be higher than the February hike.

Shifting to the New Zealand docket, a Business New Zealand PMI data report released last Friday showed factory activity in New Zealand expanded for the second month in January. The Business NZ Performance of Manufacturing Index in New Zealand increased to 52 in February of 2023 from an upwardly revised 51.2 in the prior month, marking the second straight month of growth in manufacturing activity since September 2022. New orders (52.0) returned to expansion after five consecutive months of contraction, while finished stocks (55.8) and employment (54.0) both continued to expand. That said, the upbeat data was a key factor underpinning the Kiwi and helped exert upward pressure on the NZD/USD pair.
As we advance, without any significant economic news data from both dockets, the FEDS monetary policy, the U.S. bond yields, and the broader market risk sentiment will influence the U.S. dollar demand and allow traders to grab some trading opportunities around the pair. However, the focus now shifts to releasing the U.S. Consumer Price Index (CPI) and Core CPI data on Tuesday for fresh directional impetus.
Technical Outlook: NZD/USD One-Day Price Chart
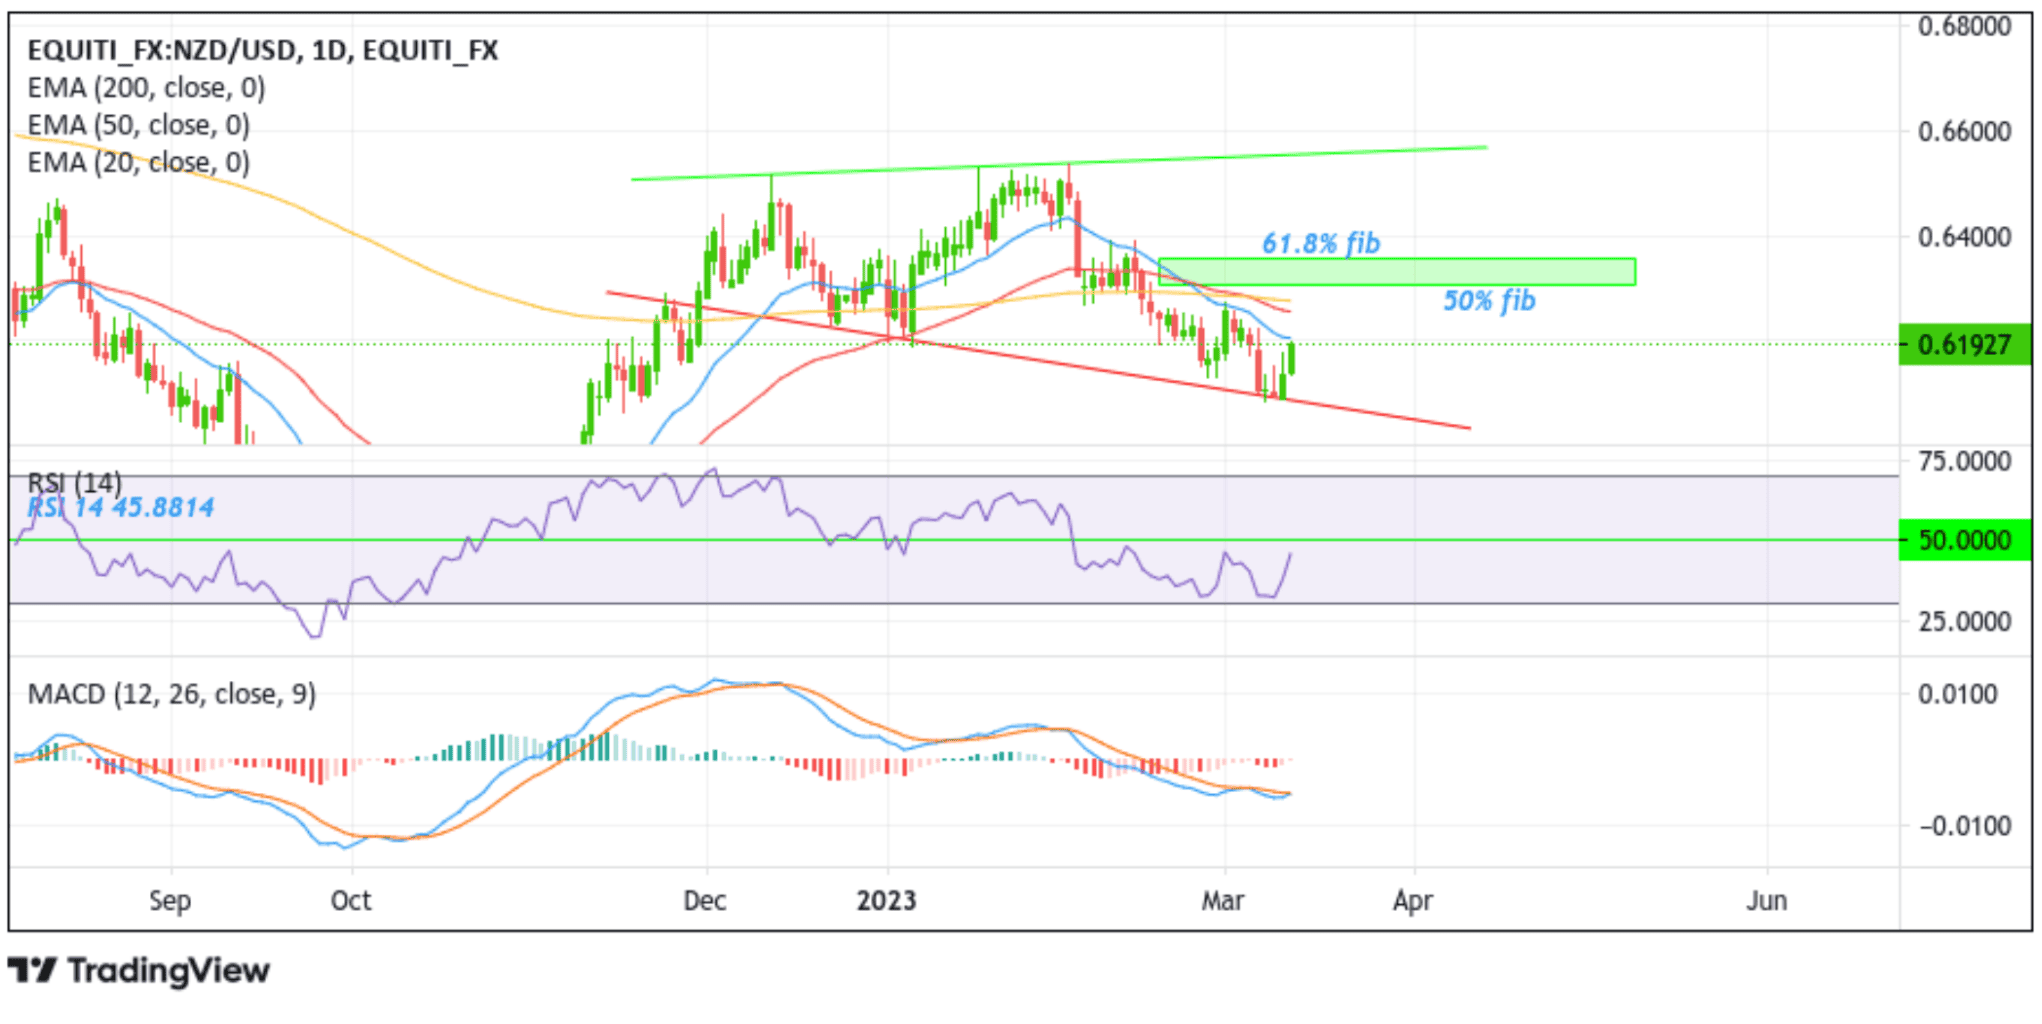
From a technical standstill, using a one-day price chart, the price has extended the modest rebound from the vicinity of 0.60841 levels after a firm rejection from the key support level plotted by a descending trendline extending from December 22, 2022, swing low. Some follow-through buying would face initial resistance at the 20 EMA level at 0.62054 level. If the buyers break above this ceiling, it will pave the way for additional gains around the NZD/USD pair. Further uptick would, however, face stiff resistance at the 50 (red) and 200 (yellow) EMA levels at 0.62566 and 0.62778 levels, respectively; hence further uptick seems elusive for the time being
All the technical Oscillators in the chart are holding in bearish territory, with both the RSI (14) and the MACD crossover below their signals, pointing to a bearish sign for price action this week. The bearish bias is supported by accepting a price below the 200 Exponential Moving Average (EMA) at 0.62778. Additionally, the 50 (red) and 200 (yellow) EMA crossover (Golden cross) at the 0.63167 level adds credence to the bearish bias.
That said, if dip-sellers and technical traders jump in and trigger a bearish turnaround, the price will first find support at the 0.61593 support level. On further weakness, the focus shifts lower toward retesting the key support level plotted by a descending trendline extending from December 22 2022, swing low. If sellers manage to breach this floor (bearish price breakout) it would negate any near-term bullish outlook and pave the way for aggressive technical selling around the NZD/USD pair.