NZD/USD Clings To Upbeat N.Z. Trade Balance Data-Led Gains Above 0.64700 Mark, FED's Decision Awaited


- NZD/USD cross attracts some-dip buying from the vicinity of the 0.64774 level to lift spot prices to new daily high and trade just a few pips below a key supply zone
- New Zealand trade gap falls in December
- US PCE Inflation cooled in December while U.S. Economy grew more than expected in Q4

NZD/USD pair came under renewed buying pressure on Monday after attracting fresh bullish bets during the early hours of the Asian session to lift off spot prices from the vicinity of the 0.64774 level. At the time of speaking, the pair is up over 10 pips for the day and has recovered part of its lost ground from last week amid upbeat New Zealand Trade data. The shared currency looks set to maintain its offered tone going forward to the European session.
New Zealand's trade balance gap fell in December to NZD 475 million, the lowest in seven months, and below an NZD 990.3 million gap in December 2021. Further details show that Goods exports rose 11% to NZD 6.7 billion, led by milk powder, butter, and cheese; casein and caseinates; and wine, while goods imports increased at a slower 1.8% to NZD 7.2 billion, prompted by purchases of aircraft and parts.
Across the pacific, data released on Friday by the U.S. Bureau of Economic Analysis showed US PCE Inflation cooled in December. Core PCE prices in the U.S., which exclude food and energy, went up by 0.3% month-over-month in December of 2022, compared to a 0.2% increase in the prior month and line with market estimates. The annual rate, the Federal Reserve's preferred gauge of inflation, fell to 4.4% from 4.7% in November, marking the slowest increase in 14 months. Meanwhile, the headline index edged up 0.1% last month, the same as in November. In the 12 months through December, the index increased by 5.0%, the least since September of 2021, and below 5.5% in November.
Commenting on the report, "The latest inflation data has allowed Fed officials to guide markets to a slower pace and given their preference on the duration of restrictive monetary policy, we expect a moderation in price pressures to result in the Fed taking rates to a terminal level of 5% by March," Harvey said.
Traders of futures tied to the Fed's policy rate kept bets on Friday that the U.S. central bank will raise interest rates just once more beyond next week's widely expected quarter-point hike before stopping. CME's FED watch tool is, in fact, pricing in a 99.9% likelihood of a 25bps rate hike in this week's fed interest rate decision announcement.
Following the report's release, the U.S. Treasury bond yields climbed on Friday, with the yield on the benchmark 10-year Treasury up by a little over 2 basis points to 3.515% after topping 3.52% earlier in the session. In comparison, the 2-year Treasury yield was last seen trading at 4.205% after rising by around 3 basis points. Yields and prices have an inverted relationship, and one basis point equals 0.01%. On the other hand, the U.S. Dollar index (DXY), which measures the value of the United States Dollar relative to a basket of foreign currencies, clung to modest gains and rose by 0.3% to trade at $102.61.
The treasury bond yields were also supported by an upbeat U.S. GDP data report which showed the U.S. economy grew more than expected in Q4 of 2022. The U.S. economy expanded an annualized 2.9% on quarter in Q4 2022, following a 3.2% jump in Q3 and beating forecasts of 2.6%, the Commerce Department reported last Thursday. Consumer spending, which accounts for about 68% of GDP, increased 2.1% for the period, down slightly from 2.3% in the previous period but still positive.

As we advance, the backdrop seems tilted in favour of the Kiwi Bulls. Investors seem convinced that the Reserve Bank of New Zealand will deliver a larger rate hike in its following interest rate decision announcement following surging inflation, a data report confirmed last week. The inflation rate in New Zealand rose 7.20 percent YoY in the fourth quarter of 2022 to the same level of 7.20 percent in the third quarter of 2022. The prices rose at a faster pace for food (10.7% vs 8% in Q3), alcoholic beverages and tobacco (5.9% vs 4.7%), Household contents (8.2% vs 7.1%), and health (8.2% vs 7.1%).
However, the focus remains on the Fed's interest rate decision announcement on Wednesday, which it is expected to lower its fed rates to 25bps. Investors will look for clues on the FED's post-interest rate decision announcement press conference on the FED's action toward battling inflation against a tough global economic backdrop.
Technical Outlook: Four-Hours NZD/USD Price Chart
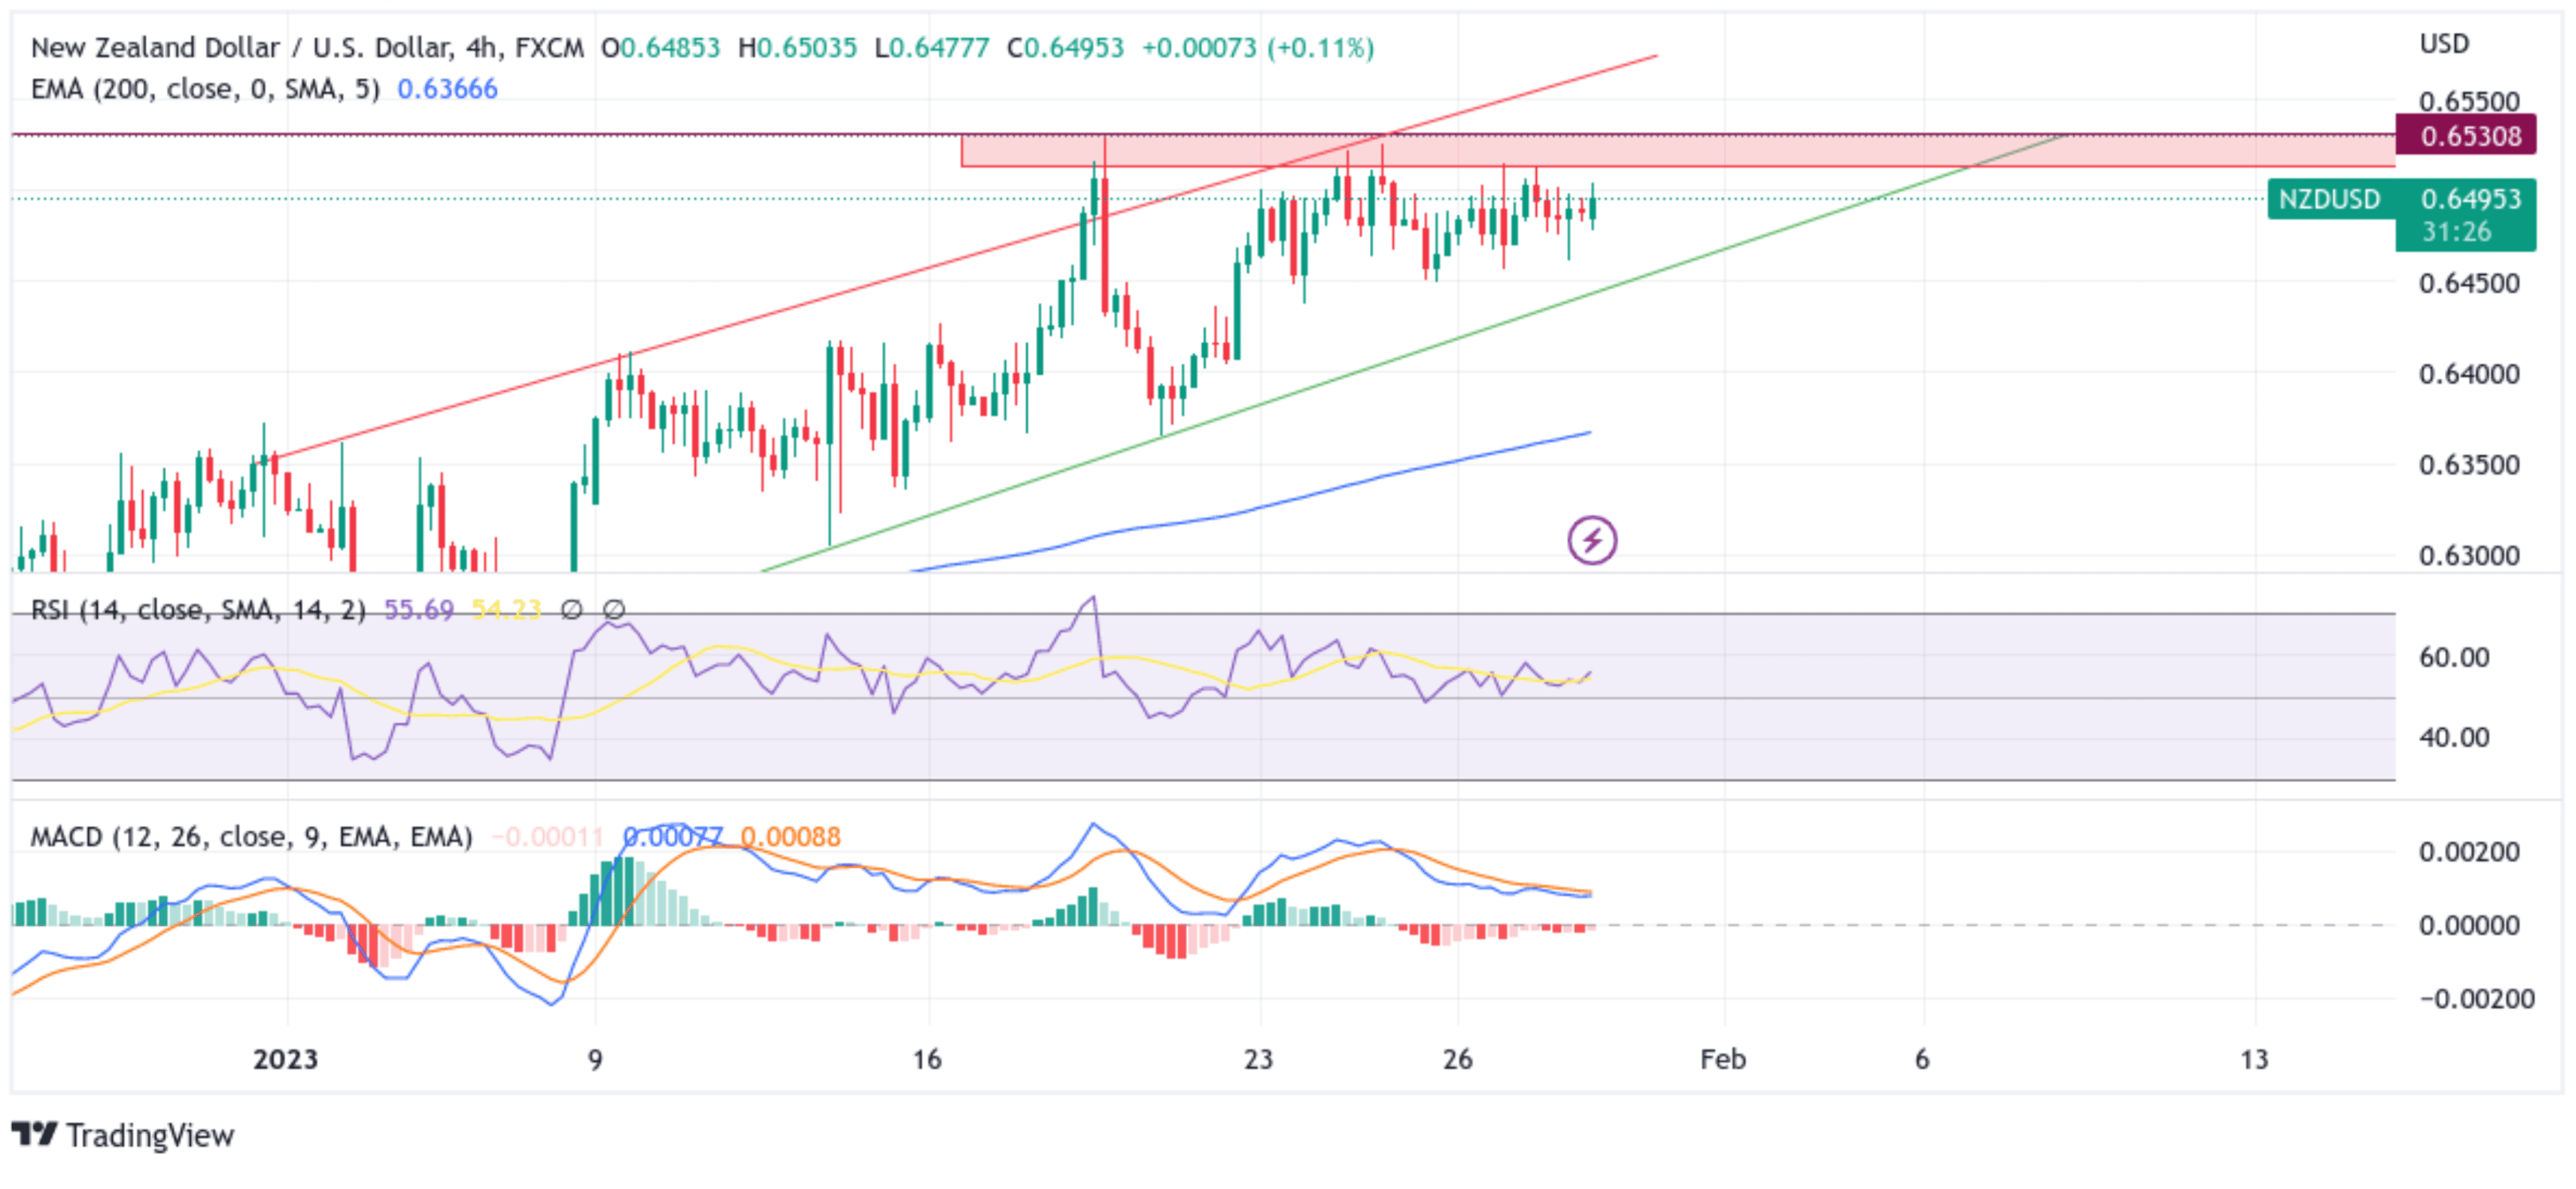
From a technical standstill using a four-hour price chart, the price has extended the sharp pullback from the vicinity of the 0.64612 level. Some follow-through buying would lift spot prices to the immediate hurdle (supply zone ranging from 0.65125 - 0.65315 levels). Sustained strength above the aforementioned barricade would be a fresh trigger for bulls to continue pushing up the price and pave the way for additional gains. The upside trajectory could then accelerate toward retesting a key resistance level plotted by an ascending trendline extending from the early January 2023 swing high. A break above this barrier would pave the way for aggressive technical buying around the NZD/USD pair.
All the technical oscillators are in positive territory, with the RSI (14) at 55.59 above the signal line, portraying a bullish filter. On the other hand, the Moving Average Convergence Divergence (MACD) Crossover is also above the signal line, pointing to a bullish sign for price action this week.
On the flip side, any meaningful pullback now finds some support near the demand zone ranging from 0.64803 - 0.64902 levels. This is followed by a support level (shown in lower time-frames) plotted by an ascending trendline, which, if broken decisively, will negate the positive outlook and fast technical selling. The downward trajectory could then accelerate toward retesting the key support level plotted by an ascending trendline extending from mid-January 2023 swing higher-low, which, if broken convincingly, would pave the way for aggressive technical selling.