Gold Holds Steady Above The 1660 Mark Amid U.S. Dollar Weakness; U.S. PCE Inflation Data Awaited


- XAU/USD pair gains positive traction on Friday to lift spot prices to a one-week high around 1662.983- 1665.27 levels
- U.S. dollar weakness gives some relief to Gold
- Weaker U.S. data offer support to the non-yielding yellow metals and exert upward pressure on the pair
- The prospects for more aggressive central banks could also contribute to capping the XAU/USD
- Fed's favourite inflation data can challenge the upside momentum on firmer readings

XAU/USD pair prolonged its recent strong move over the past five days and gained traction for the fourth successive day on Tuesday. The momentum lifted spot prices to a one-week high, around 1662.983 - 1665.27 region, during the first half of the Asian Session.
The Non-yielding yellow metal continued its steady climb on Friday, staging a small recovery from two-year lows buoyed by U.S. dollar weakness. Gold prices were set to lose nearly 3% in September, following a series of hawkish moves and commentary by the U.S. Federal Reserve. A spike in the dollar, which jumped to 20-year highs earlier this month, also pressured Gold. The U.S. Dollar index (DXY), which measures the value of the United States dollar relative to a basket of foreign currencies, retreated on Thursday from its 20-year high at 114.776 level touched on Wednesday and was last seen trading at 111.841 on Friday as at 04:02 UTC +3. This, in turn, was seen as a key factor offering support to the dollar-denominated Gold.
The USD downtick could be solely attributed to a goodish pickup in demand for the British pound, though a combination of factors could help limit more profound losses. Further uplifting Gold prices were the firmer prints of the U.S. Weekly Initial Jobless Claims, which dropped to 193K for the period ended on September 24, versus the 209K previous (revised from 213K) and the market expectation of 215K, also might have weighed on the DXY. The U.S. Jobless Claims slumped to the lowest levels since April. While respecting the data, St. Louis Federal Reserve Bank President James Bullard praised the slump in the weekly Initial Jobless Claims and mentioned, "We will push inflation to 2% in a reasonable compact time frame." Elsewhere, Federal Reserve Bank of Cleveland President Loretta Mester said on Thursday that they are not yet at a point where they could start thinking about stopping interest rate hikes, as reported by Reuters.

This, in turn, triggered a fresh leg up in the U.S. Treasury bond yields and acted as a tailwind for the greenback. Investors also took stock of data that U.S. GDP (Gross domestic product) fell at an unrevised 0.6% annualized rate in the second quarter, compared with a much larger contraction of 1.6% in the first quarter. The second-quarter decrease was the same as previously estimated in the "second" estimate released in August. Despite the hawkish Fedspeak, fears from the U.K., Russia, and China also challenged the sentiment and the XAU/USD bulls but couldn't chain the prices. Comments from Bank of England Chief Economist Huw Pill amplified pessimism surrounding Britain as the policymaker said, "It is hard not to conclude that all this will require significant monetary policy response," he told a conference. "We must be confident in the stability of the U.K.'s economic framework." A day after the sterling hit an all-time low against the U.S. dollar, Phill said, the BOE's MPC was "certainly not different" compared to the sell of in the pond and gilts.
That said, record-high inflation in Germany, which jumped to 10.9% this month, far beyond expectations for a reading of 10%, also challenged the risk appetite. Additionally, Russia's readiness to annex more parts of Ukraine and the chatters over China's inability to tame recession continue to challenge the overall risk appetite.
Going forward, Focusing on the U.S., it is very difficult to envision the Fed changing course like its peer on the other side of the Atlantic, especially after its recent guidance has reinforced the message that borrowing costs will have to continue to rise and remain high for some time to bring inflation down and force it back to the 2% target. This means that nominal U.S. bond rates will soon resume their ascent, paving the way for real yields to remain elevated and continue to weigh on precious metals, as has been the case over the past few months. In this environment, the U.S. dollar is likely to command strength, preventing gold prices from staging a durable recovery, at least in the near term. Against this backdrop, traders could soon begin to fade the rally in XAU/USD.
As we advance, the Focus in the market is now on the Fed's preferred inflation gauge, namely the Core Personal Consumption Expenditure (PCE) Price Index for September, expected 4.7% YoY versus 4.6% prior. Should the actual outcome arrives stronger, the XAU/USD prices may witness hardships in rising. Due today, investors will take further cues on the Chinese manufacturing activity data. Factory activity in the world's largest Gold importer is expected to have weakened for a third consecutive month.
Technical Outlook: One-Day Gold Price Chart
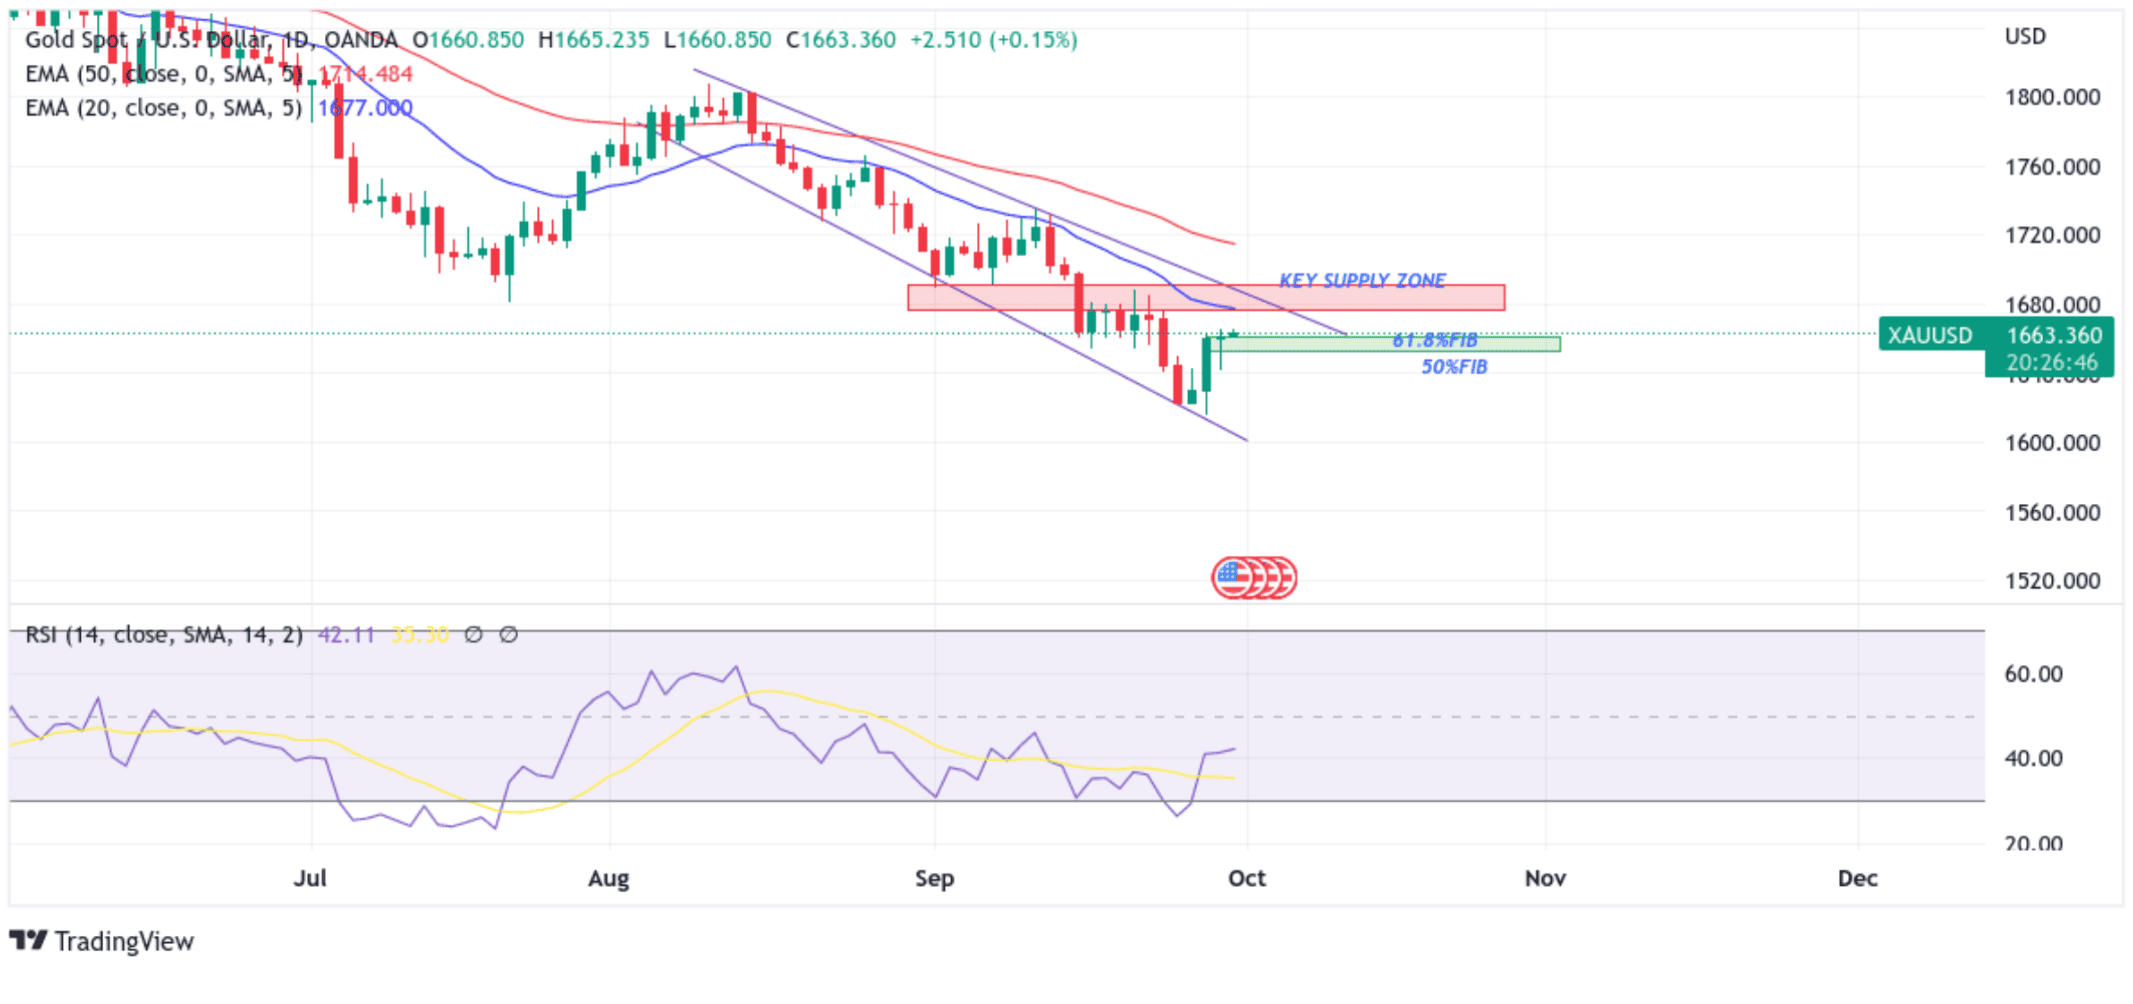
From a technical standstill using a four-hour price chart, the price has extended the modest rebound from the sloping trendline(support level) plotted from 1st September lower-low. The price has broken above the 50% and 61.8% Fibonacci retracement levels planned at 1651.726 and 1660.507, respectively. Some follow-through buying would lift spot prices to the key Supply zone ranging from 1675.714 - 1691.267 levels. The zone above would act as an immediate hurdle against the pair; however, if buyers manage to breach this ceiling, upside pressure could accelerate, paving the way for a surge towards the 1729.354 - 1745.85 supply zone level.
The Impending moving average convergence divergence (MACD) bullish crossover adds credence to our bullish filter. The RSI(14) level at 42.11 is in bullish territory and adds credence to the upside move.
On the Flipside, dip-sellers and tactical traders jump back in and trigger a bearish reversal; initial resistance appears at the 50% and 61.8% Fibonacci retracement levels at 1652.654 and 1649.770 levels, respectively, when using a four-hour chart. If the price pierces this barrier, selling interest could gain momentum, creating conditions for a drop toward the 1642.212 level. Further weakness below this floor would expose the pair to more losses.