GBP/USD Rebounds Modestly From YTD Low, Amid Minor Correction, BOE Interest Rate


- GBP/USD attracts fresh buying amid minor price correction
- A fresh leg up in the US Treasury Bond Yields offers support to the safe-haven greenback
- Firming expectations of a 50bps interest rate hike in BOE's upcoming monetary policy decision underpins the cable and exert upward pressure on the pair
- BOE interest rate decision to provide the next leg of a directional move for the GBP/USD pair
GBP/USD pair came under renewed buying pressure on Tuesday after attracting bullish bets during the early hours of the Asian session to lift off spot prices from the vicinity of the 1.22460 level. At the time of speaking, the pair is up over eight pips for the day and has managed to recover part of its early lost ground. The shared currency looks set to maintain its offered tone going forward to the European session and extend the corrective pullback.
The current price action suggests the market has priced in a 50bps interest rate hike decision by the BOE in its august interest rate decision. Most investors seem convinced that the BOE would stick to a 50bps interest rate hike in its upcoming monetary policy meeting to tackle the surging inflation, which increased to 9.4% in June, the highest rate since 1982. Additionally, The latest flash U.K. composite readings registered in July was 52.8, down from 53.7 in June and the lowest reading since February 2021. The better-than-expected reading reaffirmed market bets for a 50bps interest rate by the Bank of England in its august meeting on Thursday. Additionally, brent crude oil prices rose on Tuesday and settled at $0.31 or 0.31% higher at $99.97 per barrel. The combination of factors offered some support to the cable and exerted upward pressure on the shared currency.
A fresh leg up in the U.S. Treasury Bond Yields on Tuesday and a softer risk tone offered some support to the safe haven-green back. This came on the backdrop of disappointing U.S. economic data. The U.S. ISM manufacturing PMI index fell to the lowest level since July 2020, according to the latest report released by the institute of supply management. The latest data indicated a drop of 0.2 from 53 to 52.8 against a lower-than-expected preliminary reading of 52.
Further indications continue to the point that the U.S. economy is in recession, which FED officials have outrightly denied. FED Chair Jerome Powell last week denied the U.S. is in recession as he said job growth and wage measures are strong and not consistent with a recession. According to the latest GDP report, the U.S. economy contracted for the second straight quarter. Gross domestic product fell 0.9% at an annualized pace for the period, according to the advance estimate. That followed a 1.6% decline in the first quarter and was worse than the Dow Jones estimate for a gain of 0.3%. A second consecutive negative quarter for GDP provides further evidence that, at best, economic momentum continued its marked slowdown. The negative GDP reading meets a long-held, basic view of recession. This, in turn, was seen as a factor that offered some support to the safe-haven greenback.
Going forward, market participants now look forward to second-tier U.K. economic data, which along with the broader risk sentiment, will influence the GDP price dynamics. On the U.S. docket, investors will look for cues from the release of JOLTs job openings report for march scheduled for release during the mid-north American session. That said, the focus remains on the BOE monetary policy statement report scheduled for release on Thursday. The report would influence the near-term USD price dynamics. This, in turn, should assist traders in determining the next leg of a directional move for the GBP/USD pair.
Technical Outlook: Four-Hours GBP/USD Price Chart
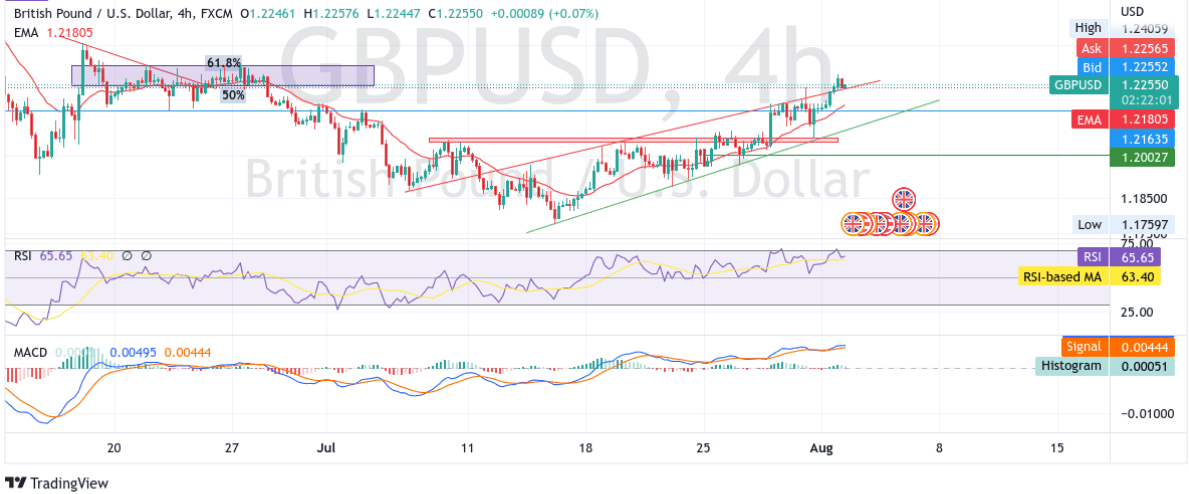
From a technical standstill using a four-hour price chart, the price rebounded modestly from the 1.22460 level after finding support near the upper horizontal trendline of the ascending channel pattern formation, plotted from 6th July. Some follow-through buying would lift spot prices to the immediate hurdle ranging from 1.26637-1.23424 levels, coinciding with bearish Fibonacci retracement levels at 61.8% and 50%, respectively. The said barrier, if broken convincingly, would pave the way for additional gains.
The moving average convergence divergence (MACD) crossover at 0.00402 adds to the bullish filter. The 20 and 200 Exponential Moving Average(EMA) crossover at the 1.21605 level adds credence to our bullish filter. The RSI(14) level at 65.65 is not far away from flashing oversold levels but validates our bullish filter.
On the Flipside, a pullback toward testing the upper horizontal trendline of the ascending channel pattern turned support zone followed by a convincing break below the aforementioned trendline would negate any near-term bullish bias and pave the way for technical selling.