FTSE 100 Index Futures Takes A Breather As Consumer Resilience Helps To Push The Exporter-Heavy Index


- The UK 100 Index Futures retreated on Friday during the early Asian session after gaining as much as 0.51%/39.51 points
- U.S. Consumer prices fell 0.1% in December, in line with expectations from economists
- Tesco shares are up 9% year-to-date after Q3 results
- The best-performing sector on Friday was the Consumer Discretionary Sector, led by Persimmon (London: PSN), while the worst-performing sector was the Information Technology sector, led by Sage Group Plc (London: SGE)

The UK 100 Index Futures rebounded on Friday from the vicinity of 7828.19 level. They slipped lower during the Tokyo session after surpassing their 2018 heights in Wednesday’s session, as most sectors and major bourses closed in positive territory on Thursday despite a choppy afternoon following the release of U.S. inflation data.
As per press time, the exporter-heavy FTSE 100 futures was down 0.08%/6.21 points, trading at £7808.26 after gaining as much as 0.51%/39.51 points on Thursday after a U.S. Bureau of Labor Statistics report showed consumer prices in December posting their most significant monthly decline since early in the pandemic.
The consumer price index, which measures the cost of a broad basket of goods and services, fell 0.1% for the month, in line with the Dow Jones estimate. That equated to the most significant month-over-month decrease since April 2020, as much of the country was in lockdown to combat Covid.
Even with the decline, headline CPI rose 6.5% from a year ago, highlighting the persistent burden that the rising cost of living has placed on U.S. households. However, that was the smallest annual increase since October 2021.
Excluding volatile food and energy prices, the so-called core CPI rose 0.3%, also meeting expectations. Core was up 5.7% from a year ago, again in line.
The sharp fall in inflationary pressures in the U.S. is helping to translate into weakness in U.K. gilt yields, with the prospect that lower inflation and lower rates will combine to create a faster decline and thus diminish the longer-term economic damage to consumer wallets.
This is helping to boost housebuilders even as Persimmon (London: PSN) followed Barratt Developments (London: BDEV) yesterday in recording a similar slowing in its sales numbers. Private net weekly sales fell to 0.19 from 0.61 in the same period a year ago, an even sharper fall than Barratt. However, the shares have pushed to the top of the FTSE 100 as yields fall back and raise the hope of lower mortgage rates.
Despite painting a weak demand outlook for the rest of the year, the sector has seen significant share price declines over the last 12 months. Persimmon (London: PSN) is down over 50% from its peak last year, so it could be argued that a lot of negative news is already in the price, with today’s falling inflation numbers pointing to optimism that some of the worst-case scenarios might be avoided.
Tesco shares are up 9% year-to-date after Q3 results
In the 19 weeks to 7 January, Tesco group (London: TSCO) sales increased by a solid 6.6% to £21.8 billion, described by the company as a ‘strong performance’ with ‘particular strength in fresh food’, which rose by 8.1%.

This success can be attributed to a few key factors: its value for money has increased, with the ‘Aldi Price Match’ promotion on 600 key products working in synergy with clubcard prices. Indeed, sales volume on Tesco’s ‘Everyday’ range of products increased by more than average at 7.4%. Meanwhile, the ‘Finest’ range also saw sales rise by 8.2%, though some of this growth was due to the range of goods offered increasing by 22%.
In the FTSE 100 Index, the best-performing sector on Friday was the Discretionary Sector led by Persimmon (London: PSN), which rose 8.33%/108.0 points to trade at £1404.5 per share. The financial sector was followed second, led by M&G Plc (London: MNG), which gained 6.24%/11.9 points to trade at £202.70 per share. The materials sector came in third, led by Polymetal Inc (London: POLYP), which added 4.96%/14.9 points to sell at £315 per share.
On the other hand, the worst-performing sector was the Information Technology sector, led by Sage Group Plc (London: SGE), which lost 1.97%/15.40 points to trade at £767.6 per share. The Healthcare sector came in second, topped by AstraZeneca Plc (London: AZN), which declined 1.60%/186 points to sell at £11,448 per share. The utility sector came in third, led by SSE Plc (London: SSE), which shed 1.33%/22.5 points to trade at £1670 per share.
Technical Outlook: Four-Hours FTSE 100 Future Index Price Chart
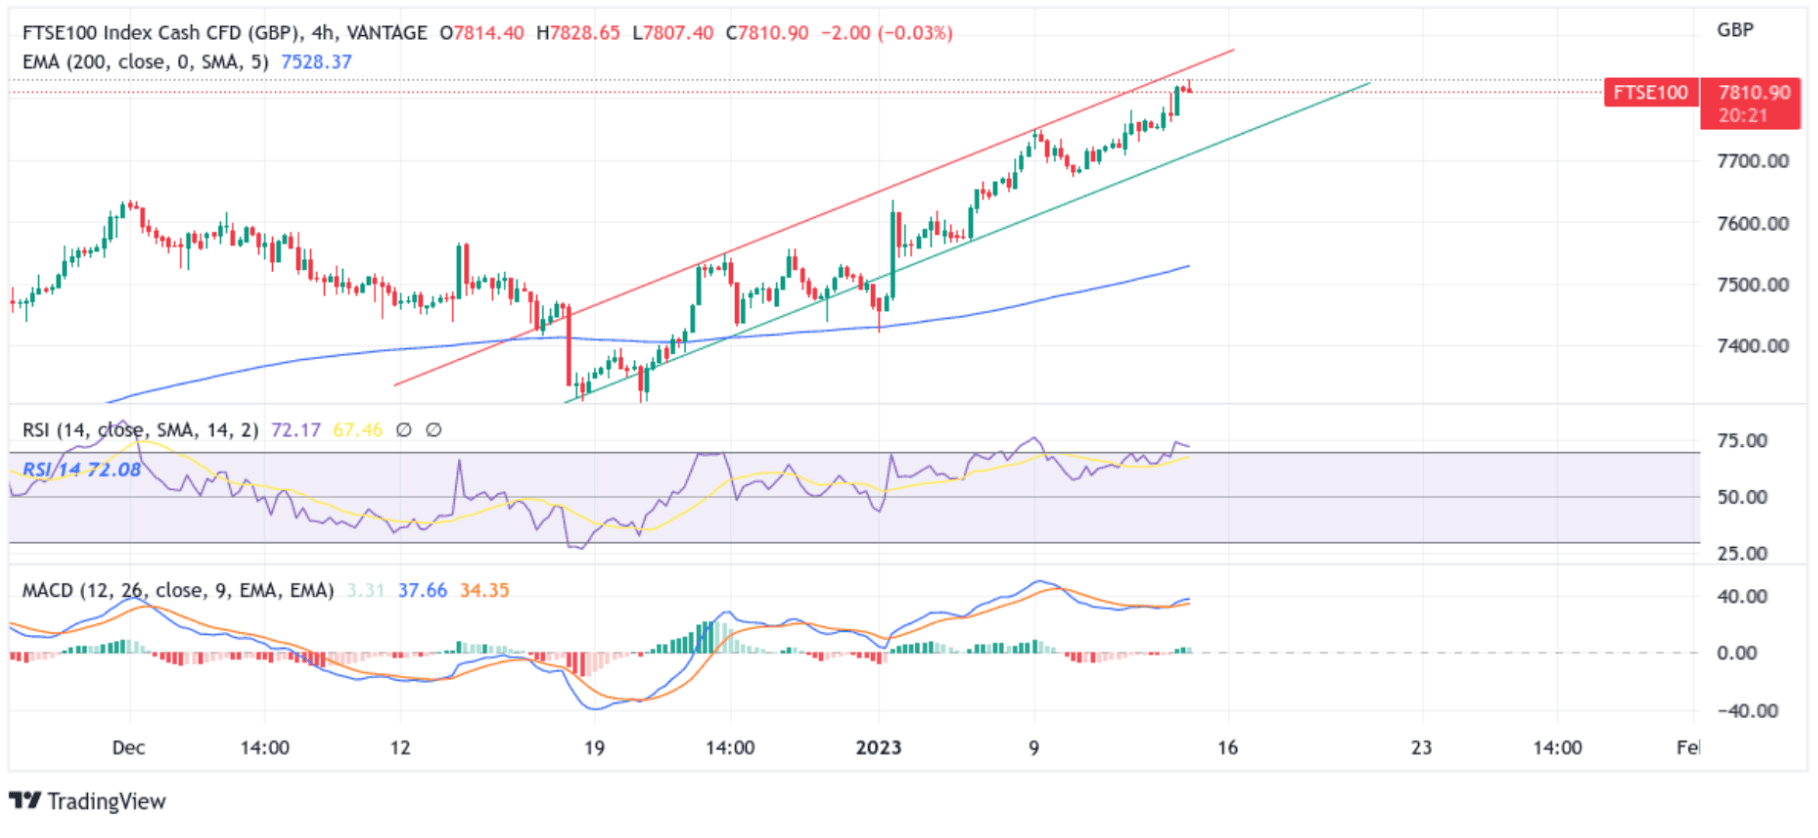
From a technical standstill using a four-hour price chart, the price has rebounded from the vicinity of the 7828.19 level. If the price manages to weaken further in the coming session, it will face stiff resistance at the 50% and 61.8% Fibonacci retracement levels at 7779.52 and 7767.84 levels, respectively. Suppose sellers manage to breach these key floors. In that case, downside momentum could pick up the pace, paving the way for a drop toward retesting the key support level plotted by an ascending trendline of the ascending channel pattern extending from the mid-December 2022 swing low. A convincing break below the aforementioned support level (bearish price breakout) will pave the for additional losses around the FTSE 100 Futures index.
All the technical oscillators are in positive territory, with the RSI (14) at 72.08 above the signal line and flashing overbought conditions. Still, a subsequent move below the overbought (70) line would support the bearish narrative. On the other hand, the Moving Average Convergence Divergence (MACD) Crossover is also above the signal line, pointing to a bullish sign for price action. Still, a move below the signal line would add credence to the downside bias.
On the flip side, if dip-buyers and tactical traders jump back in and trigger a bullish reversal, initial resistance appears at the key resistance level plotted by an ascending trendline of the ascending channel pattern extending from the late-December 2022 swing high. Buying interest could gain momentum if the price pierces this barrier, creating the right conditions for an advance toward the 2018 record high of 7,900.