Brent Crude Oil Prices Rally On Remarks On Prospects of Potential Cuts


Brent Crude Oil prices rose on Tuesday to push crude oil prices above $100 a barrel after oil prices rose after Saudi Arabia floated the idea of OPEC+ output cuts to support prices and with the prospect of a drop in U.S. crude inventories. As a result, Oil prices soared more than nearly 4%/ $3 a barrel.
The Saudi energy minister said OPEC+ had the means to deal with challenges, including cutting production, state news agency SPA said on Monday, citing comments Abdulaziz bin Salman made to Bloomberg. The global benchmark on Brent crude settled at $100.22 a barrel on Tuesday, up $3.74, or 3.9%. While its counterpart, U.S. West Texas Intermediate crude, closed $3.38, or 3.7%, higher at $93.74 a barrel. The prospect of resuming Iranian crude supply and recession fears, along with consecutive weekly builds at the U.S. crude oil storage hub, easing gasoline demand. The upcoming refinery maintenance season has pushed prices lower recently and set the tone for OPEC+, said Bob Yawger, director of energy futures at Mizuho.
In the comments reported on Monday, the Saudi minister said the paper and physical oil markets had become "disconnected." However, nine OPEC sources told Reuters on Tuesday that OPEC+ production cuts may not be imminent and would coincide with the return of Iran to oil markets should Tehran clinch a nuclear deal with the West. A senior U.S. official told Reuters on Monday that Iran had dropped some key conditions for reviving the 2015 nuclear deal, including ending the IAEA(International Atomic Energy Agency) probe. However, he said. Gaps remain between the U.S. and Iran, "It's not clear an agreement will be reached", he added.
Oil prices have generally soared in 2022, coming close in March to an all-time high of $147 after Russia's invasion of Ukraine exacerbated supply concerns. Fears about a global recession, rising inflation and weaker demand have since weighed on prices.
While the price of Brent has fallen sharply from this year's high, the market structure and price differentials in the physical oil market still point to supply tightness stemming from sanctions on significant producer Russia over its invasion of Ukraine. Following the sanction, many energy companies in Europe consuming Russian oil faced technical issues on the banking front when making payments for crude oil. It is worth remembering the southern branch of the Druzhba pipeline, which transports Russian oil across Ukraine to Hungary, Slovakia, and the Czech Republic stopped pumping for six days. After Russian state-owned pipeline operator Transneft said it could not pay transit fees to Kyiv because of sanctions on Russia over the invasion of Ukraine. A stand-off threatened crude supplies to central Europe, ultimately leading to a surge in brent oil prices. However, Flows of Russian crude oil to Hungary(along a critical supply route from Russia to Europe) were later restored after the Hungarian energy company MOL managed to pay the oil transit fees to Ukraine on behalf of a Kremlin-controlled company.
That said, the Global Oil demand outlook remains clouded by increasing worries about an economic slump in the United States and Europe, debt distress in emerging market economies, and a strict zero COVID-19 policy in China, the world's largest oil importer.
Technical Outlook: Four-Hour Brent Price Chart
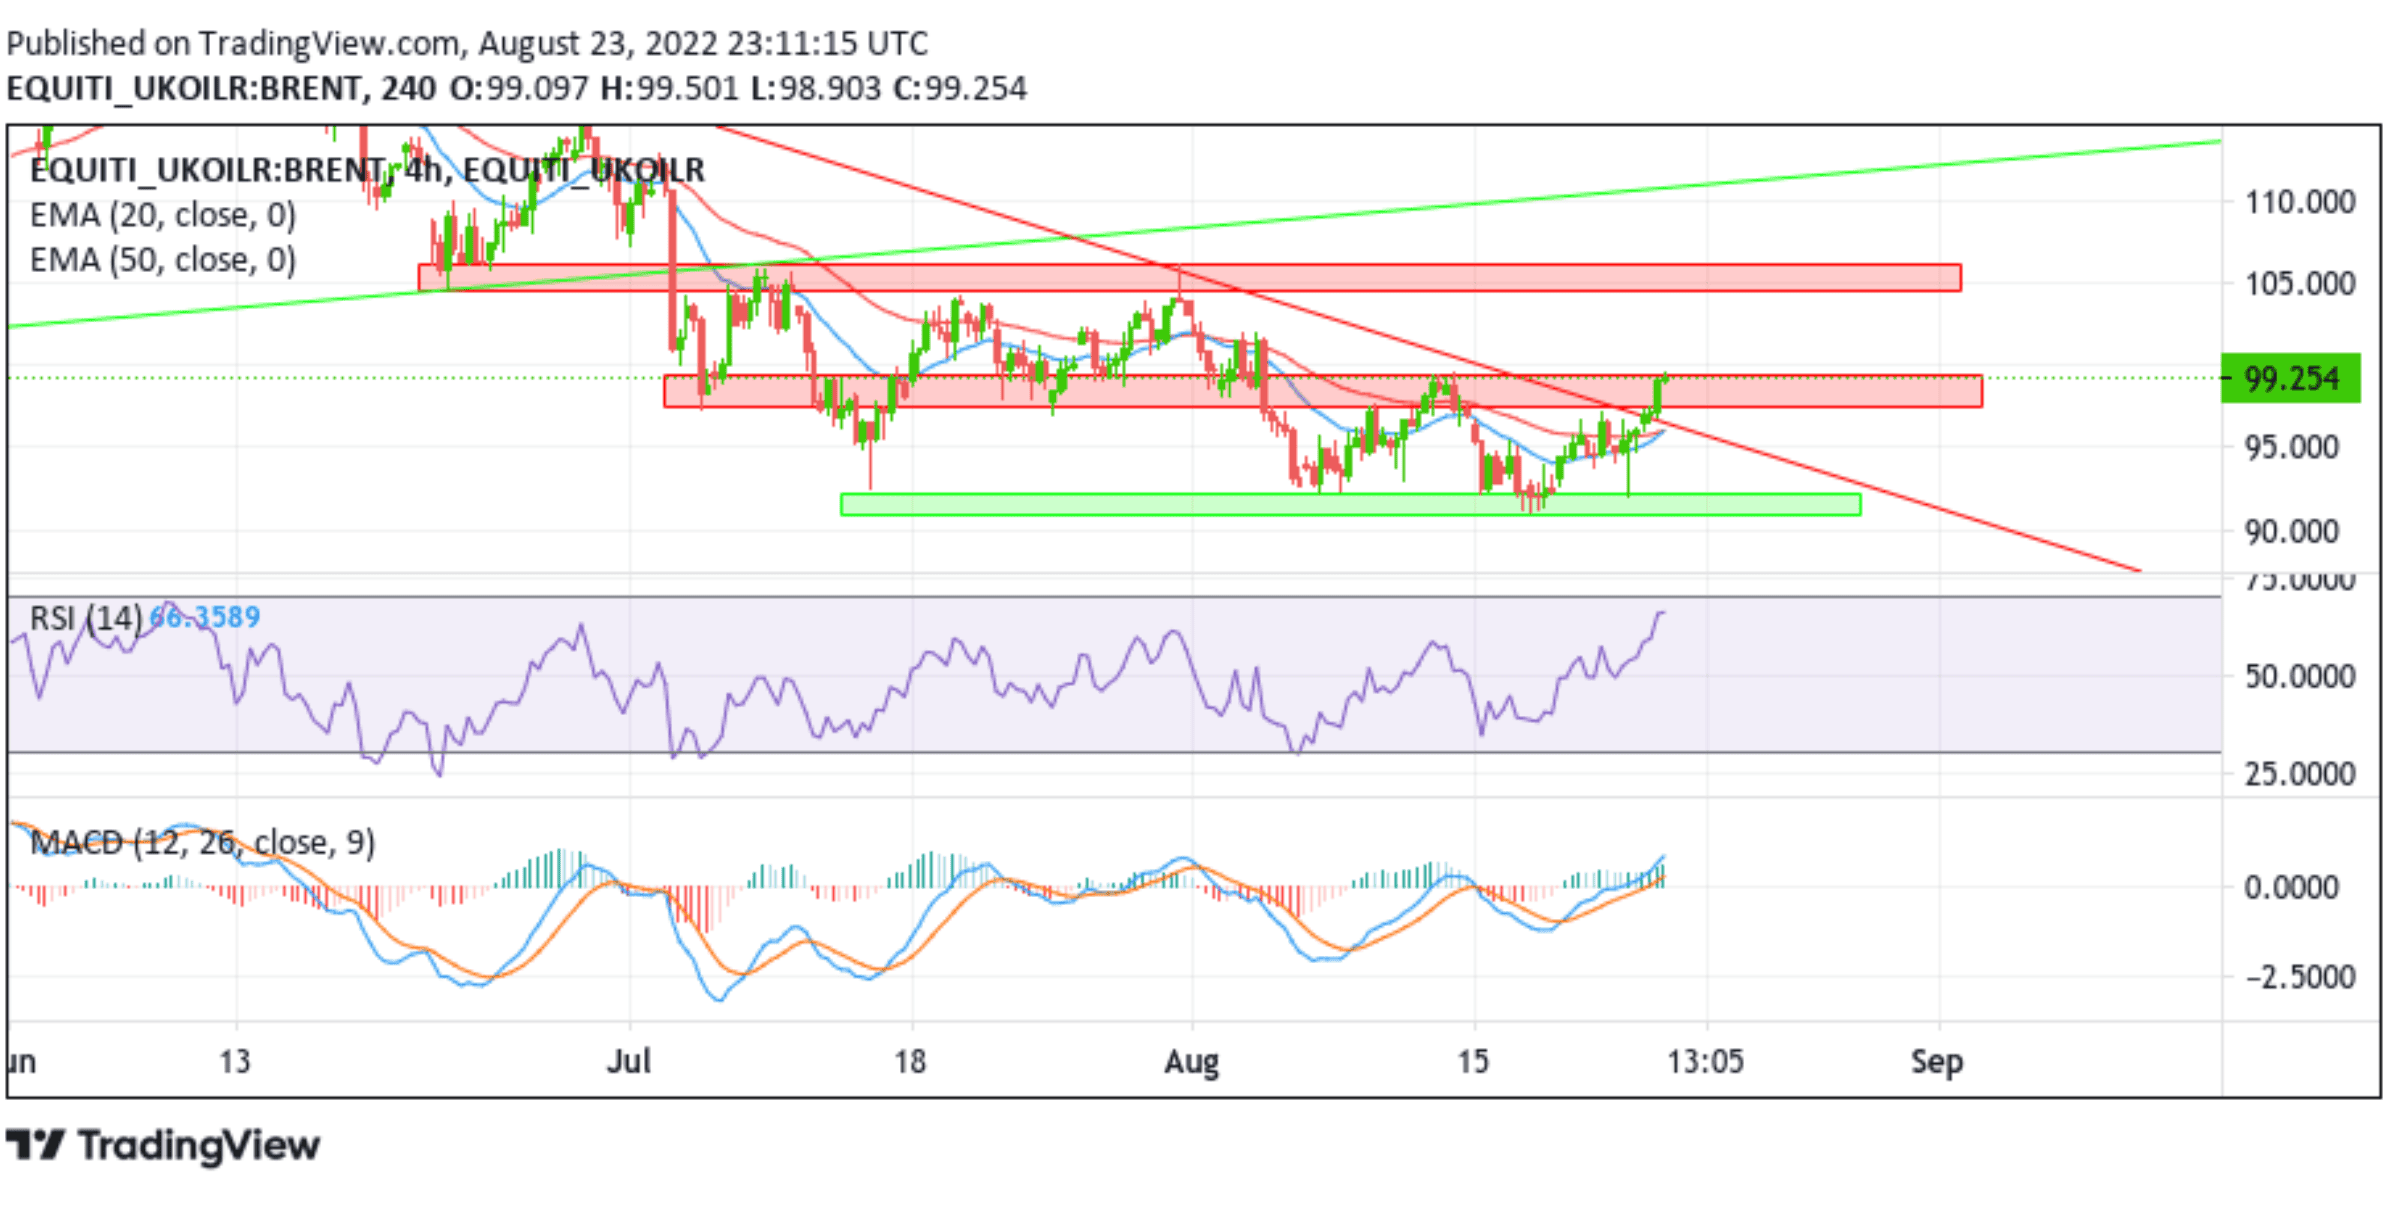
From a technical perspective, spot prices are now looking to extend the momentum beyond the downward-sloping trend-line from the June 2022 swing high. The move beyond the previous YTD top at around the 96.200 mark confirmed a solid bullish breakout and supported prospects for additional gains. However, the bullish momentum faces stiff resistance from the immediate hurdle(supply zone), ranging from 97.447 to 99.370 levels. The aforementioned zone would act as a barricade against the pair against any further uptick; however, a clean break above the mentioned hurdle would be seen as a new trigger for bulls to continue pushing the price up and pave the way for additional gains.
The RSI(14) level at 66.5389 is on the verge of breaking into overbought territory and warrants some caution ahead of this week's key events/data risks. The moving average convergence divergence (MACD) crossover at -1.0117 paints a bullish filter. Additionally, The 20 and 50 Exponential Moving Average(EMA) crossover at the 93.510 level on the one-hour chart further adds to the upside bias.
On the flip side, any meaningful pullback now seems to find some support near the 96.246-96.862 level. This is followed by the 96.200 round-figure mark, which, if broken decisively, will negate the positive outlook and prompt aggressive technical selling. The downward trajectory could then accelerate toward the demand zone ranging from 90.910- 92.374 levels.