AUD/USD Bears Cling To Downbeat Aussie PMI Data; U.S. PMI Data Awaited


- AUD/USD Pair attracts fresh selling on Monday
- The latest Aussie PMI data came in softer than expected
- China reports that third-quarter GDP grew by 3.9%, beating expectations
- The latest IHS Markit report shows mixed Aussie S&P PMI data.
- Growing risks of Monetary policy overtightening by the FED dray treasury bond yields lower

AUD/USD cross attracted some deep selling on the first day of the week after sensing a firm rejection from the vicinity of 0.63975 - 0.64115level(the former coincides with the 61.8% Fibonacci retracement level) and dragged spot prices lower below last Friday's close during the mid-Asian session. At the time of speaking, the pair is down over 25 pips for the day and looks to build upon the retracement slide heading onto the European session. The Aussie dollar's latest struggle could be attributed to the negative market sentiment surrounding Asian equity markets and pessimism surrounding Australia despite an upbeat Chinese GDP. China's GDP grew 3.9% on a year-on-year basis for the third quarter marking a pickup from 0.4% in the second quarter, bringing year-to-date growth to 3%. Analysts polled by Reuters before Oct. 18 had expected China to report GDP growth of 3.4% for the third quarter.

Additionally, Industrial production rose by 6.3%, well above the 4.5% increase expected by Reuters. While Fixed asset investment rose by 5.9% for the first three quarters of the year, a touch below Reuters' forecast of 6%. Furthermore, Fixed asset investment rose by 5.9% for the first three quarters of the year, a touch below Reuters' forecast of 6%. Further limiting the Aussie dollar is the latest IHS Markit report, which showed softer Aussie S&P PMI data. The Manufacturing PMI has escalated to 52.8 versus the projections of 52.5 but lower than the prior release of 53.0. While the Service PMI has dropped sharply to 49.0 against the consensus of 50.5 and the former release of 50.6. Additionally, Reuters reported that Australia's economic growth is expected to slow sharply next financial year as rising inflation curbs household consumption, according to new forecasts to be unveiled by Treasurer Jim Chalmers in Tuesday's budget. Furthermore, looming fears for Chinese chip companies due to the US-led restrictions, join the fears that China President Xi Jinping won't hesitate to escalate geopolitical matters with the U.S. regarding Taiwan to weigh on AUD/USD prices.

That said, however, the latest China cabinet reshuffle announced on Saturday put great weight on the relations with the U.S. Qin Gang. China's ambassador to the U.S. made it to the list of new central committee members(Politburo, the second-highest level of power) released on Saturday. Qin has actively reached out to American society and businesses. At the same time, Wang's comments during a recent trip to New York "indicates there is a desire to draw back from the intensely competitive relationship with the United States," said Dali Yang, a political science professor at The University of Chicago. "I think there may be a chance to certainly ease the tensions, hopefully, given the challenges China faces in keeping the Chinese economy growing," Yang said.

Meanwhile, commentary from Christopher Kent, Assistant Governor (Economic) at the Reserve Bank of Australia (RBA) on Monday also weighed AUD/USD fundamentals and, in turn, helped exert downward pressure on the pair. RBA policymaker believes that the timing of the economic prospects' size and rate increase will depend on the incoming data. He added that the costly U.S. dollar would restrict demand for U.S. goods and commodities. On the U.S. docket, the Wall Street Journal reported on Friday that some Fed officials were growing uneasy with the current pace of rate increases and are starting to worry about the risks of overtightening. Market expectations for a 0.75 percentage point hike in December dipped after the report, though a walk of that size in November is widely viewed as locked in.
Additionally, the yield on the 2-year Treasury, which is more sensitive to Fed rate hikes, fell more than 12 basis points to 4.481% following the report. Additionally, The 10-year Treasury yield, which hit 4.337%(14-year high) at one point during the session, fell less than one basis point to 4.219%. As per press time, all the treasury bond yields are on a downward trajectory extending Friday's modest pullback. As we advance, traders will pay close attention to the risk catalysts and the preliminary readings for the US PMIs for October. That said, AUD/USD bears will likely keep the reins amid the recently increasing hawkish Fed bets and geopolitical fears. In the meantime, the US Bond Yields and the broader market risk sentiment will influence the U.S. Dollar and allow traders to grab some trading opportunities around the pair.
Technical Outlook: One-Day AUD/USD Price Chart
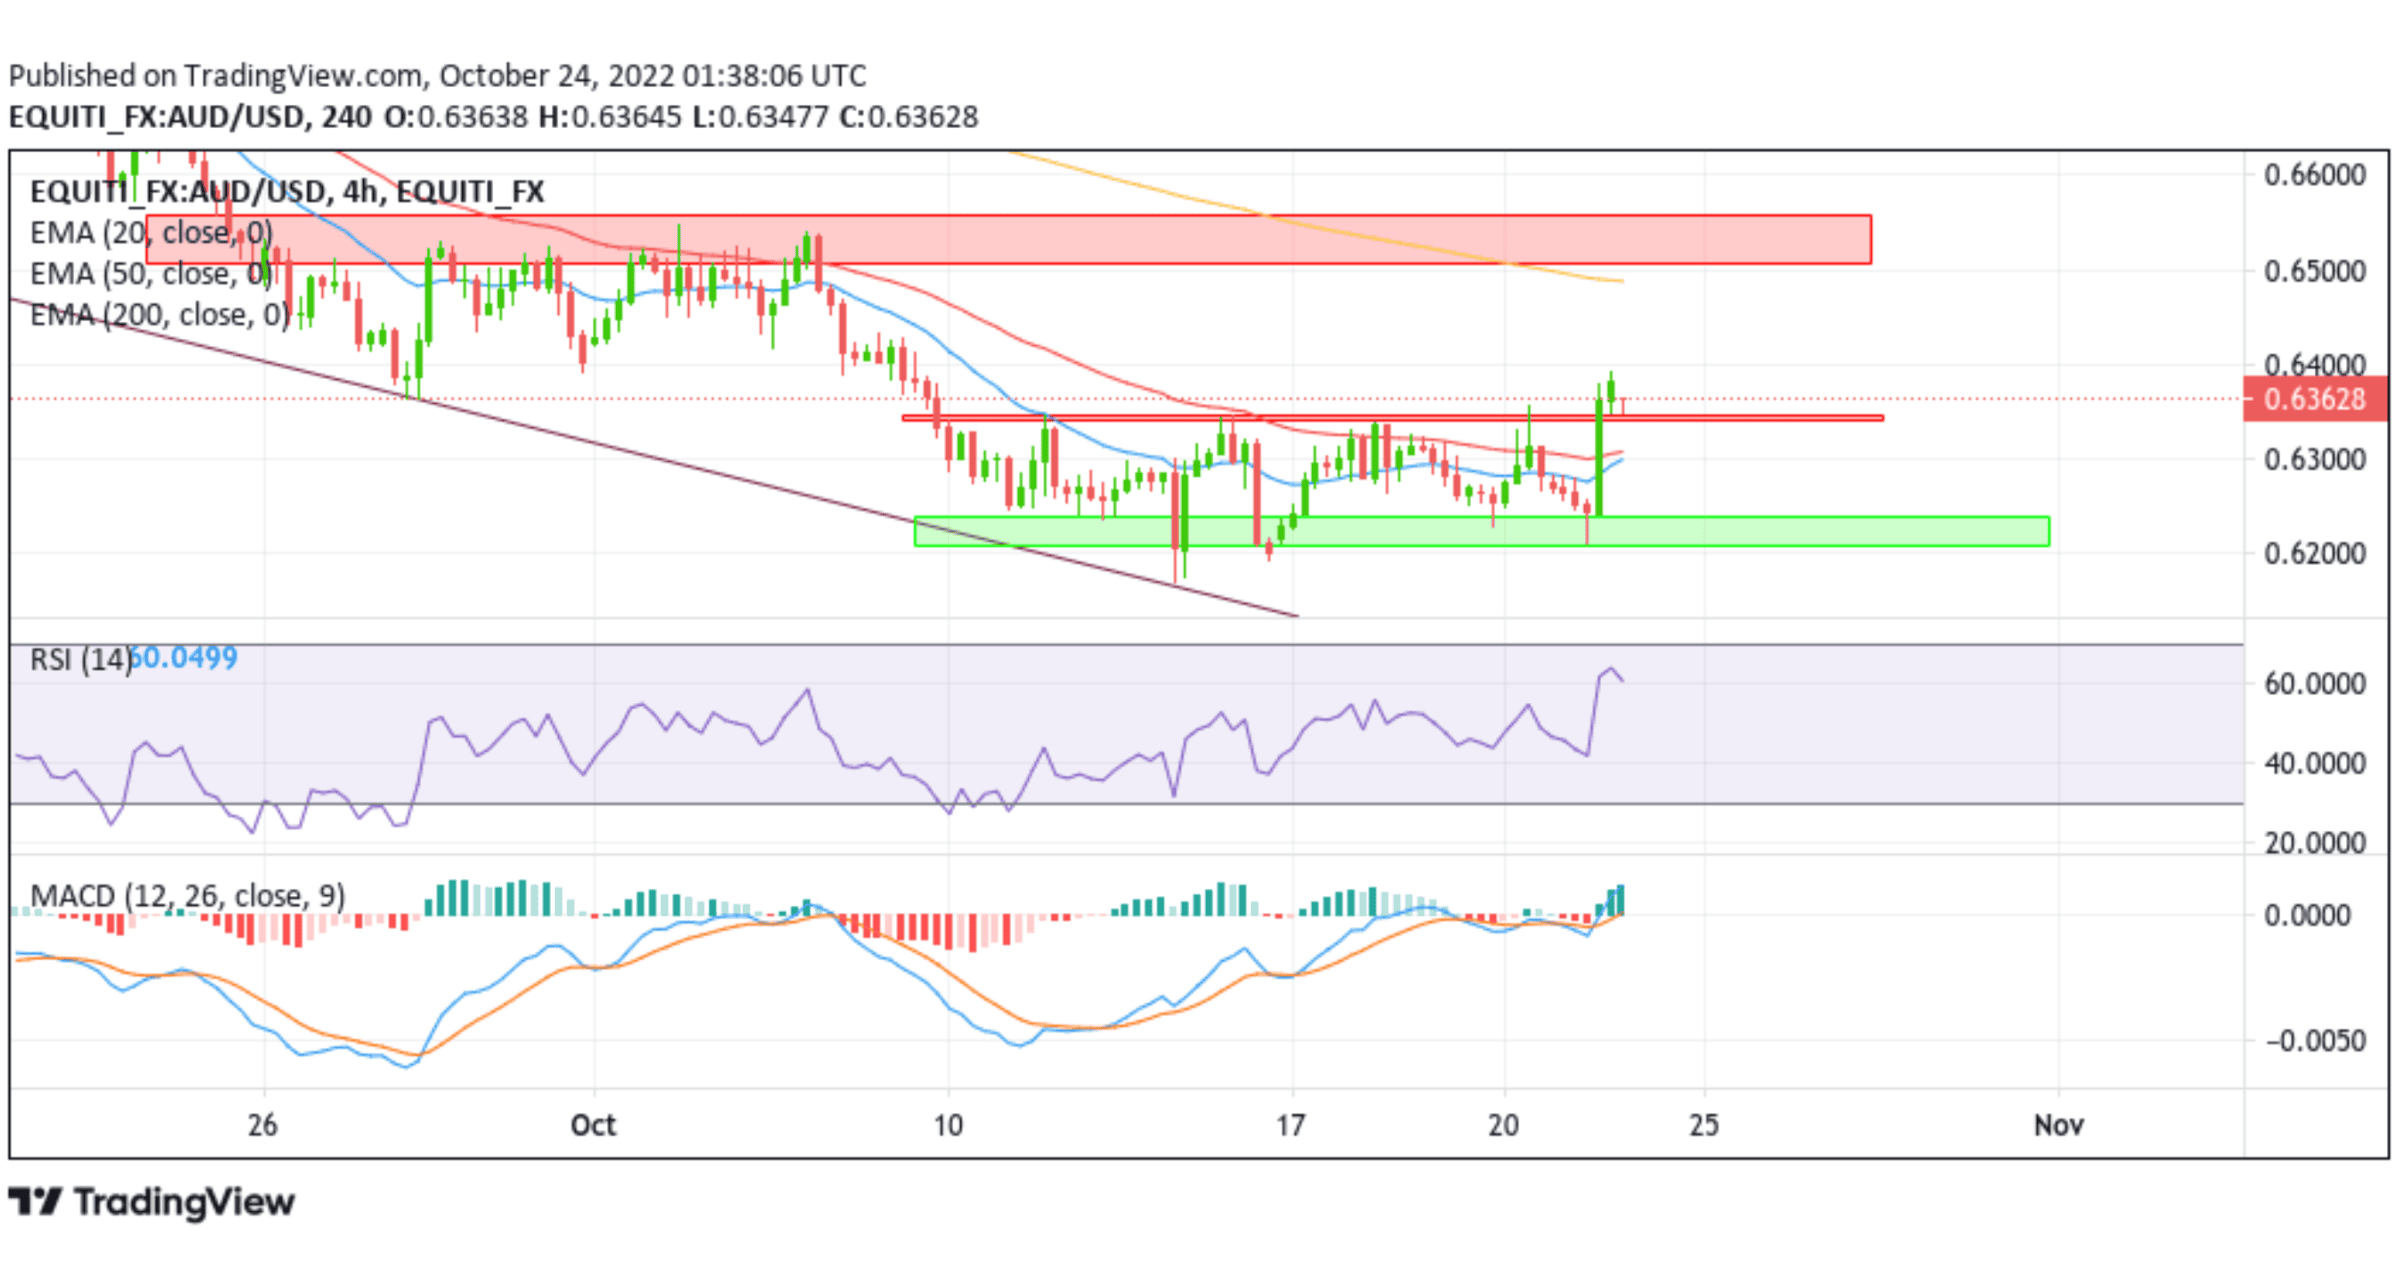
From a technical standstill, using a one-day price chart, the price rebounded modestly after strong rejection from the vicinity of 0.63975 - 0.64115level(the former coincides with the 61.8% Fibonacci retracement level. Subsequent follow-through selling would push the asset to the immediate hurdle ranging from 0.63430 - 0.63570 levels (Demand zone). The aforementioned zone would act as a barrier against the asset. However, a clean break below the aforementioned zone would be seen as a fresh trigger for bears to continue pushing the price down and pave the way for additional losses. The downward trajectory could then accelerate toward testing the demand zone ranging from 0.62149 - 0.62400 levels. If sellers manage to breach this floor, downside pressure could accelerate, paving the way for a drop toward the 0.61758 support level.
The RSI(14) level at 60.499 level is in the bullish territory, though it is showing signs of downward inclination. The Moving average convergence divergence(MACD) crossover at -0.01158 is below the signal line and portrays a bearish filter. On the other hand, the 20 and 50 Exponential Moving Average(EMA) crossover(Golden Cross) at 0.69696 adds to the overall downside bias.
On the flip side, if buyers and technical traders jump back in and trigger a bullish reversal, initial resistance appears at the 0.64366 level. If the price pierces this barrier, buying interest could gain momentum, creating the right conditions for an advance toward the 0.65377 ceilings.

