WEEKLY Global Fundamental Analysis (13-17 May)


EUR/USD
The euro seems to be losing its bullish momentum after resuming U.S. dollar buying, and further uptick at this juncture appears unlikely. The major currency hovered around $1.07725 levels on Monday during the Asian session amid a softer U.S. dollar supported by a downbeat University of Michigan survey report released on Friday, showing that U.S. consumer sentiment dropped to a six-month low in May. Furthermore, the survey's reading of one-year inflation expectations rose to 3.5% in May from 3.2% in April, remaining above the 2.3% - 3.0% range seen in the two years before the COVID-19 pandemic, suggesting the Fed could be forced to maintain its hawkish stance through 2024 at a time when Federal Reserve policymakers continue to advocate for higher interest rates in the face of persistent inflationary pressures. Moreover, the European Central Bank is expected to begin cutting interest rates in June, while the Federal Reserve is likely to wait until September or later. Markets are anticipating 70 basis points in cuts from the ECB and 45 basis points from the Fed this year. Major movements around the major currency pair are now hang on incoming key euro and U.S. macro data set for release this week. The first part of the week will be guided by the German CPI data report for April, Fed chair Powell’s speech, and the U.S. PPI data report for April. The second part of the week will feature the U.S. retail sales (Apr), the U.S. CPI data report for April, and the eurozone CPI I data report for April.
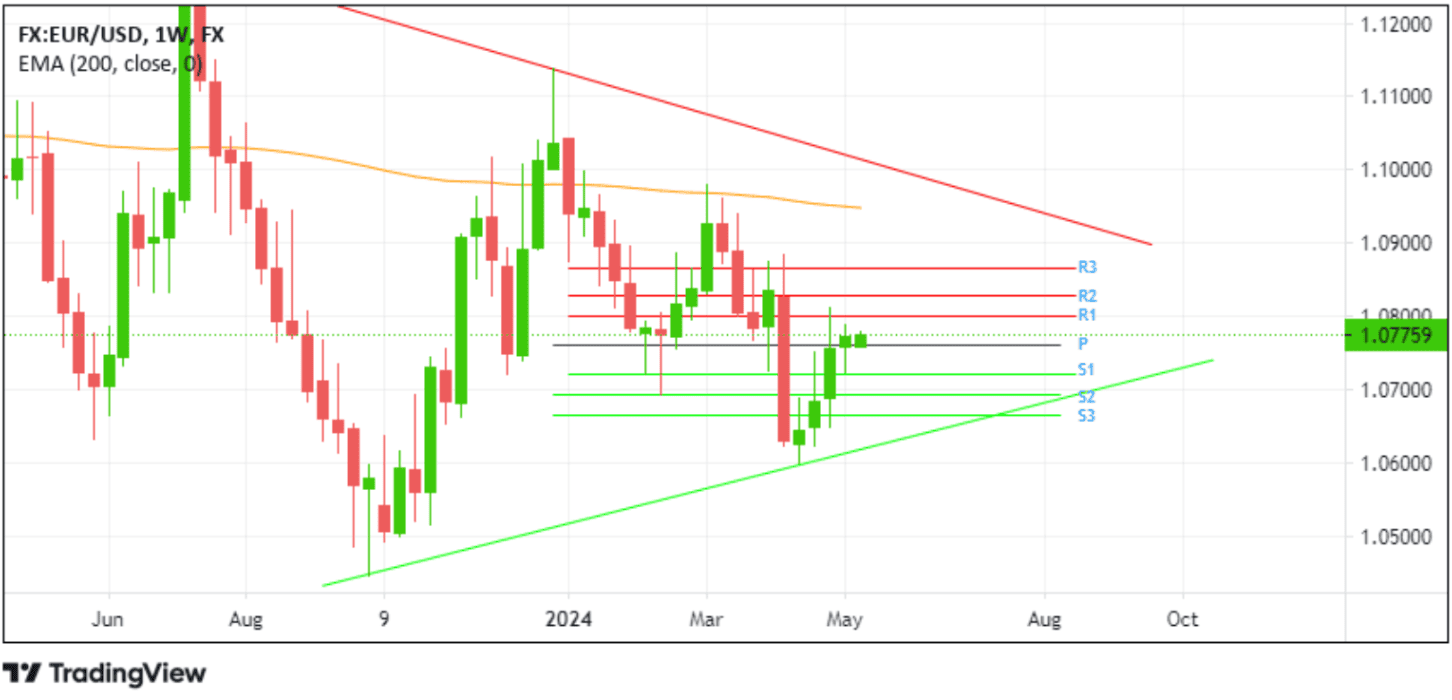
Resistance (R3): 1.0867 | Pivot Point (P.P.): 1.0762 | Support (S3): 1.0509 |
Resistance (R2): 1.0829 | Support (S2): 1.0579 | |
Resistance (R1): 1.0800 | Support (S1): 1.0672 |
GBP/USD
Like its counterpart, the euro, the sterling pound is losing its bullish appeal amid a softer U.S. dollar. The British pound has been hovering around $1.25100 levels since Friday amid a stronger U.S. dollar strengthened by last Friday’s downbeat University of Michigan survey report, which showed US consumer sentiment dropped to a six-month low in May. Furthermore, the survey's reading of one-year inflation expectations rose to 3.5% in May from 3.2% in April, remaining above the 2.3% - 3.0% range seen in the two years before the COVID-19 pandemic, suggesting the Fed could be forced to maintain its hawkish stance through 2024 at a time when Federal Reserve policymakers continue to advocate for higher interest rates in the face of persistent inflationary pressures. Data last week showed the UK economy emerged from recession as gross domestic product rose 0.6% in the first quarter, beating market expectations for a 0.4% growth. The Bank of England now projects a 0.5% expansion for the year, up from the earlier forecast of 0.25% in February. In its May meeting, the central bank
Through its Monetary Policy Committee, a majority of 7–2 voted to maintain the Bank Rate at a 16-year high of 5.25%, which aligns with market expectations. However, two committee members preferred to reduce the rate by 0.25 bps to 5%, signaling growing support for lower borrowing costs. Additionally, Governor Bailey said it is “likely we will need to cut the bank rates over the coming quarters and make monetary policy less restrictive, possibly more than currently priced into market rates". Traders slightly raised their bets for a June cut, but a 25bps reduction in August continues to be fully priced in, which continues to weigh on the cable and might help cap the upside for the pair. Significant moves around the GBP/USD will be dictated by the upcoming UK employment figures for March, the U.S. Fed chair Powell’s speech, and the U.S. PPI data report for April. The U.S. retail sales (Apr) and the U.S. CPI data report for April will also help provide directional impetus for the GBP/USD pair this week.
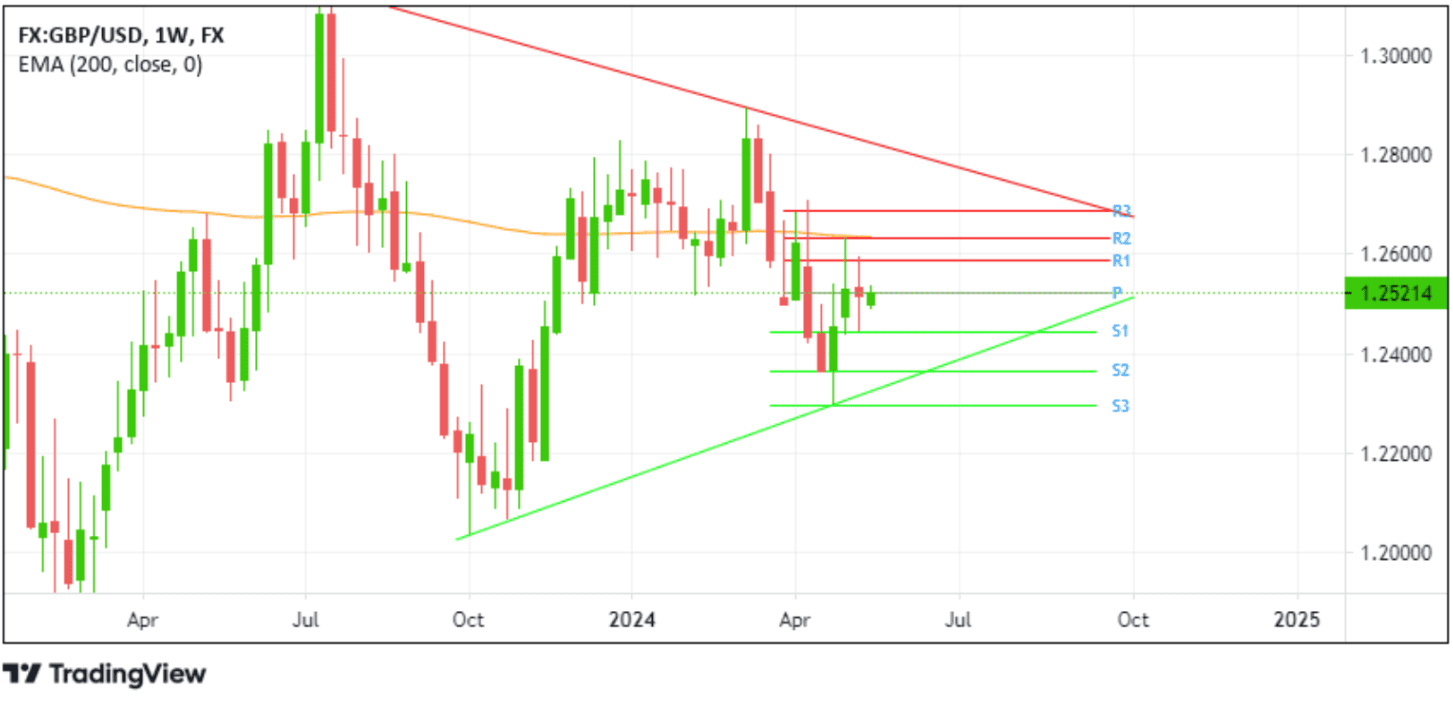
Resistance (R3): 1.26886 | Pivot Point (P.P.): 1.25220 | Support (S3): 1.22967 |
Resistance (R2): 1.26336 | Support (S2): 1.23627 | |
Resistance (R1): 1.25889 | Support (S1): 1.24445 |
USD/CHF
The Swiss franc looks poised for further declines this week due to increased U.S. dollar buying amid hawkish Fed expectations. The risk-perceived asset traded around $0.90656 against the U.S. dollar on Monday during the Asian session. Notably, the Swiss franc strengthened against the U.S. dollar early this month, rebounding from a seven-month low of $0.92 after hotter-than-expected inflation data drove markets to pare expectations on the extent of looser policy by the SNB. Annual inflation rose to 1.4% in April from the two-and-a-half-year low of 1% earlier, well above market expectations of 1.1%. Meanwhile, the U.S. dollar strengthens further against its major counterparts amid resumed Fed hawkish expectations in the wake of Friday’s downbeat University of Michigan survey report released on Friday, which showed that US consumer sentiment dropped to a six-month low in May.
Furthermore, the survey's reading of one-year inflation expectations rose to 3.5% in May from 3.2% in April, remaining above the 2.3% - 3.0% range seen in the two years before the COVID-19 pandemic, suggesting the Fed could be forced to maintain its hawkish stance through 2024 at a time when Federal Reserve policymakers continue to advocate for higher interest rates in the face of persistent inflationary pressures. As we advance, the upcoming Swiss PPI data report for April will help shape investor sentiment in the coming weeks and impact the SNB’s rate trajectory. The main focus, however, remains on the release of the U.S. Fed chair Powell’s speech, the U.S. PPI (Apr)l, the U.S. retail sales (Apr), and the U.S. CPI data report for April.
Based on USD/CHF’s weekly chart, here are the key levels to watch out for this week:
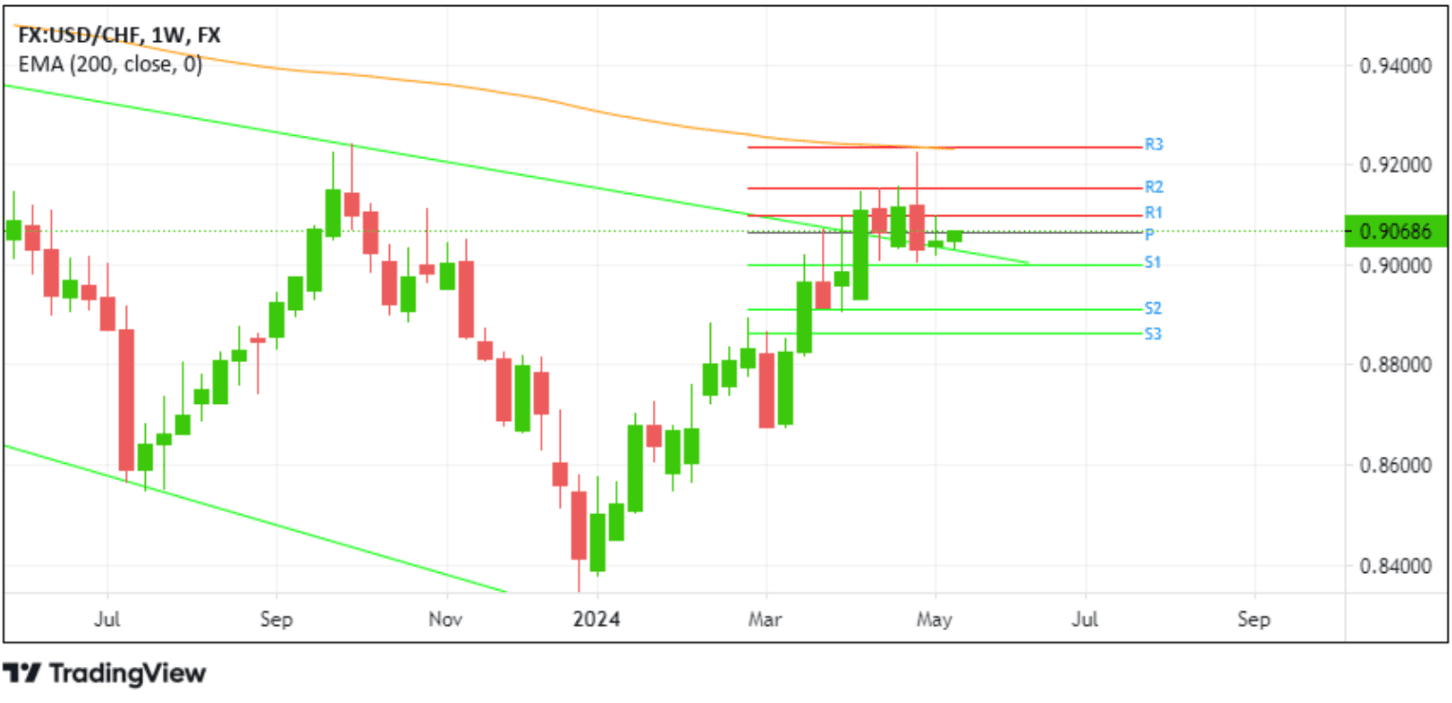
Resistance (R3): 0.92364 | Pivot Point (P.P.): 0.90660 | Support (S3): 0.88643 |
Resistance (R2): 0.91542 | Support (S2): 0.89100 | |
Resistance (R1): 0.90994 | Support (S1)0.90014 |
USD/JPY
The Japanese yen continues to show signs of further weakness against the greenback and looks likely to weaken further this week amid sustained U.S. dollar buying. Amid hawkish Fed expectations. The yen traded around $155.820 per U.S. dollar on Monday during the Asian session and remains within the vicinity of its 32-year low of $160.204 touched earlier this month. Notably, the yen lost nearly 1.85% last week, even after the Bank of Japan’s April policy meeting summary showed that the board flagged upside risks to inflation and discussed scenarios that would warrant further interest rate hikes. The report also cited the yen’s weakness as a significant factor in driving up prices, prompting attention from the central bank. Still, the BOJ expects to maintain accommodative financial conditions for the time being while assessing the outlook for economic activity and price rises.
On the other hand, the Fed is expected to maintain its hawkish stance until late this year. The bets were increased following Friday’s downbeat University of Michigan survey report, which showed that US consumer sentiment dropped to a six-month low in May. Furthermore, the survey's reading of one-year inflation expectations rose to 3.5% in May from 3.2% in April, remaining above the 2.3% - 3.0% range seen in the two years before the COVID-19 pandemic, suggesting the Fed could be forced to maintain its hawkish stance through 2024 at a time when Federal Reserve policymakers continue to advocate for higher interest rates in the face of persistent inflationary pressures. Investors look forward to the release of the upcoming Swiss PPI data report for April, which will help shape investor sentiment in the coming weeks and impact the SNB’s rate trajectory. The main focus, however, remains on the release of the U.S. Fed chair Powell’s speech and the U.S. PPI (Apr) data report on Tuesday. Additionally, investors will look for cues from the U.S. retail sales release (Apr) release and the U.S. CPI data report for April on Friday.
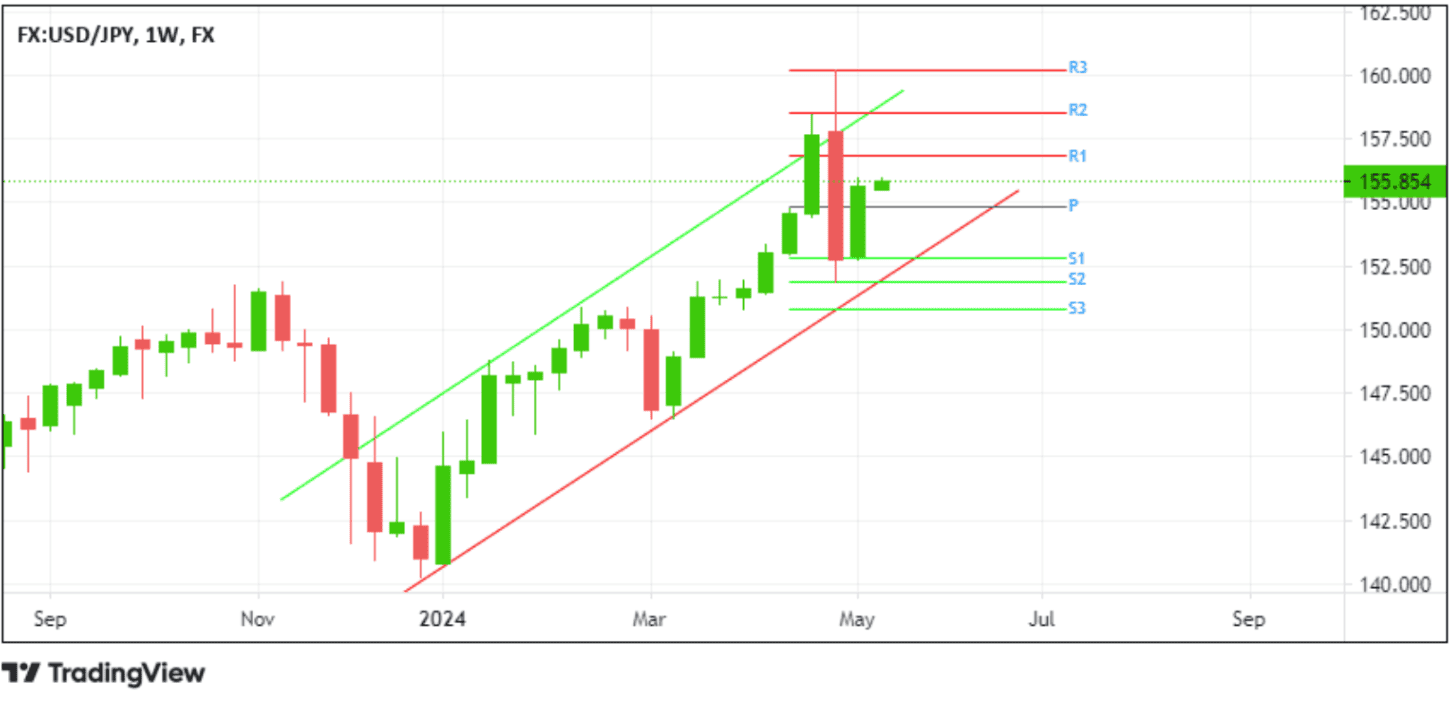
Resistance (R3): 160.221 | Pivot Point (P.P.): 154.830 | Support (S3): 150.822 |
Resistance (R2): 158.543 | Support (S2): 151.896 | |
Resistance (R1): 156.860 | Support (S1): 152.836 |
USD/CNH
This week, the offshore yuan seems vulnerable to a further drop amid a stronger U.S. dollar. The currency traded around 7.24 per dollar on Monday during the Asian session due to critical economic data from China and the looming threat of US tariffs. Data over the weekend showed a slight uptick in consumer prices in China in April 2024, marking the third consecutive month of consumer inflation this year, while producer prices continued their downward trend for the 19th straight month, albeit at a slower pace in three months. Moreover, trader sentiment has been affected by the US announcing new tariffs on strategic sectors in China this week, with expectations that the full announcement will mostly retain existing levies. Furthermore, the modest U.S. dollar strength continues as a headwind to the USD/CNH pair. This comes amid resumed market bets that the Fed will prolong its hawkish stance until the end of the year following Friday’s downbeat University of Michigan survey report released on Friday, which showed US consumer sentiment dropped to a six-month low in May. Furthermore, the survey's reading of one-year inflation expectations rose to 3.5% in May from 3.2% in April, remaining above the 2.3% - 3.0% range seen two years before the COVID-19 pandemic. In the future, investors look forward to crucial U.S. and Chinese key macro data releases this week; Fed chair Powell’s speech and the U.S. PPI (Apr) data report will grace markets on Tuesday while the Chinese Industrial Production (Apr), Chinese unemployment rate (Apr), the U.S. retail sales (Apr) and the U.S. CPI data report for April driving price action on Friday.
Based on USD/CNH’s weekly chart, here are the key levels to watch out for this week:
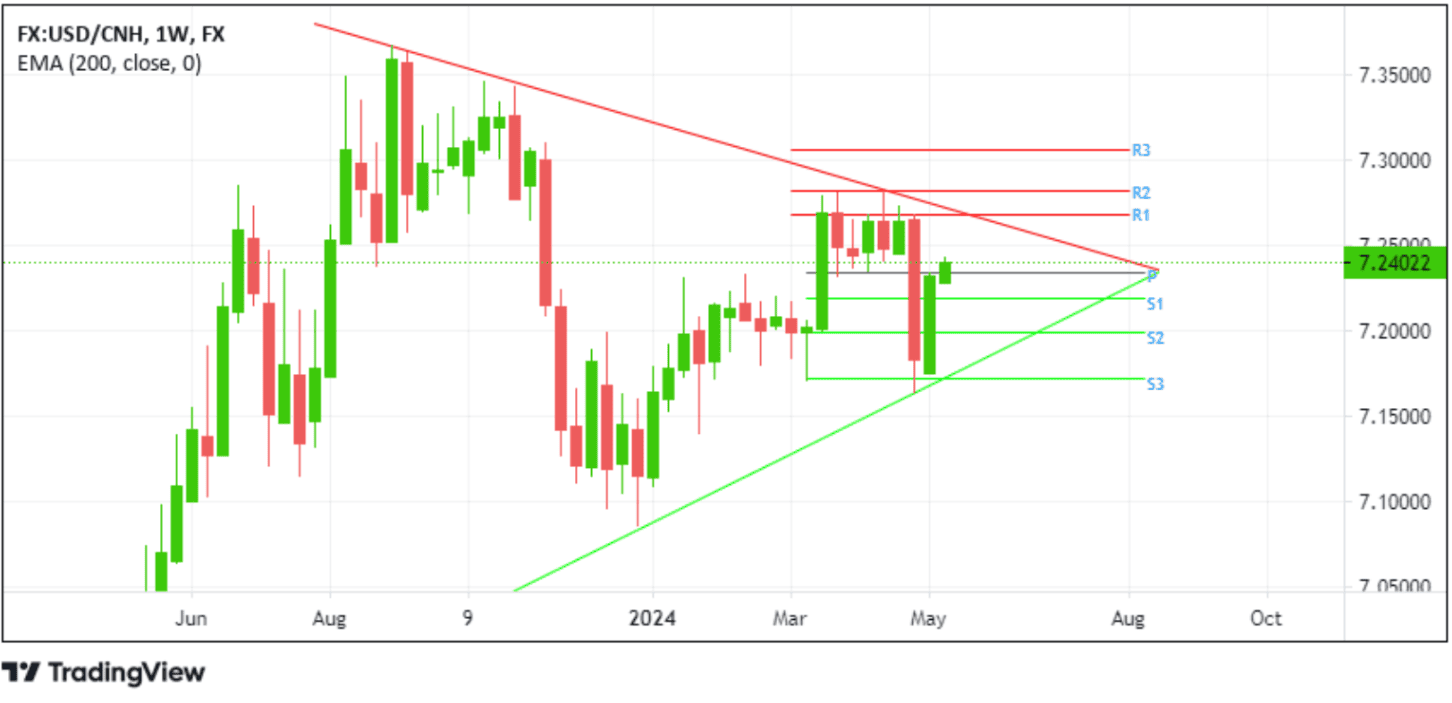
Resistance (R3): 7.3065 | Pivot Point (P.P.): 7.2340 | Support (S3): 7.1719 |
Resistance (R2): 7.2825 | Support (S2): 7.1986 | |
Resistance (R1): 7.2683 | Support (S1): 7.2190 |

Looking to grow your wealth through social trading? Look no further than Pocket Trader! With Pocket Trader, you can connect with other traders, learn from experienced investors, and share your own insights with the community! Trade wiser now 🔥