USD/ZAR Sinks Further Toward 18.6000 Mark On Weaker U.S. Dollar, All Eyes Now On U.S Confidence Data


Key Takeaways:
- USD/ZAR weakens toward the 18.6000 mark, weighed by a combination of international and domestic factors
- Bets that the Fed is done with rate hikes continue to weigh on the buck and help cap the upside for the pair
- Weaker-than-expected U.S. new home sales data undermines the buck
- SARB's updated growth forecast and SA's better-than-expected retail sales data underpin the South African Rand (Rand)
- Markets gear for the release of the U.S CB confidence data
USD/ZAR Pair extended its corrective slide from the vicinity of the 18.956 level or monthly high. They witnessed selling for the fourth successive day on Tuesday, dragging spot prices further below a crucial support level broken the previous day and near the 18.60000 mark amid the prevalent U.S. dollar selling.
A combination of international and domestic factors assisted the South African Rand (ZAR) in appreciating further against the U.S. dollar for the fourth consecutive day on Tuesday. Firm market expectations that the Federal Reserve is done with its rate-hiking cycle remained supportive of the recent pullback in U.S. Treasury bond yields, which in turn weighs on the buck and helps exert downward pressure on the USD/ZAR pair. This comes after minutes of the November meeting revealed that Federal Reserve officials at their most recent meeting expressed little appetite for cutting interest rates anytime soon, particularly as inflation remains well above their goal.
Apart from this, two U.S. Bureau of Labor Statistics reports released last week pointed to cooling inflation pressures at the consumer and producer level, which, together with slowing job and wage growth, fully reinforce market expectations that the Fed is done with its monetary policy tightening campaign. CME's Fed watch tool shows that Fed fund futures traders have priced in a 100% chance that the Fed will leave its Fed Funds rates unchanged at 5.25% - 5.5% during the December meeting.

Additionally, the Rand continues to draw support from the decision by the, which, despite unanimously leaving its key repo rate steady at 8.25% on November 23rd, 2023, in line with expectations, lifted its GDP growth forecast to 0.8% for this year (up from 0.7%), to 1.2% for 2024 (vs 1%), and 1.3% for 2025 (vs 1.1%). The SARB projection also indicated stability at 4.5% for 2025 and 2026.
Moreover, the Rand continues to be underpinned by better-than-expected South Africa retail sales data, which rose by 0.9% from a year earlier in September 2023, following a downwardly revised 0.3% decrease in the prior month and better than market forecasts of a 0.1% increase. Every month, retail sales increased by 0.1% in September, after an upwardly revised 0.3% rise in the previous month.
Furthermore, the buck is weighed further by the weaker-than-expected U.S. Census Bureau report released on Monday, which showed sales of new single-family houses in the United States fell by 5.6% to a seasonally adjusted annualized rate of 679 thousand in October 2023, well below forecasts of 723 thousand, as the highest mortgage rates in two decades weigh on buyers affordability.
As we advance, traders look forward to the U.S. docket featuring the release of the CB Consumer Confidence (Nov) data report, which is expected to show a further decline in consumer confidence in the, which in turn would further weigh on the buck and, help exert additional downward pressure on the shared currency. The main focus, however, remains on the release of U.S. Quarter 3 and the Fed's preferred inflation (Core PCE Index) data reports set for release on Wednesday and Thursday, respectively.
Technical Outlook: Four-Hours USD/ZAR Price Chart
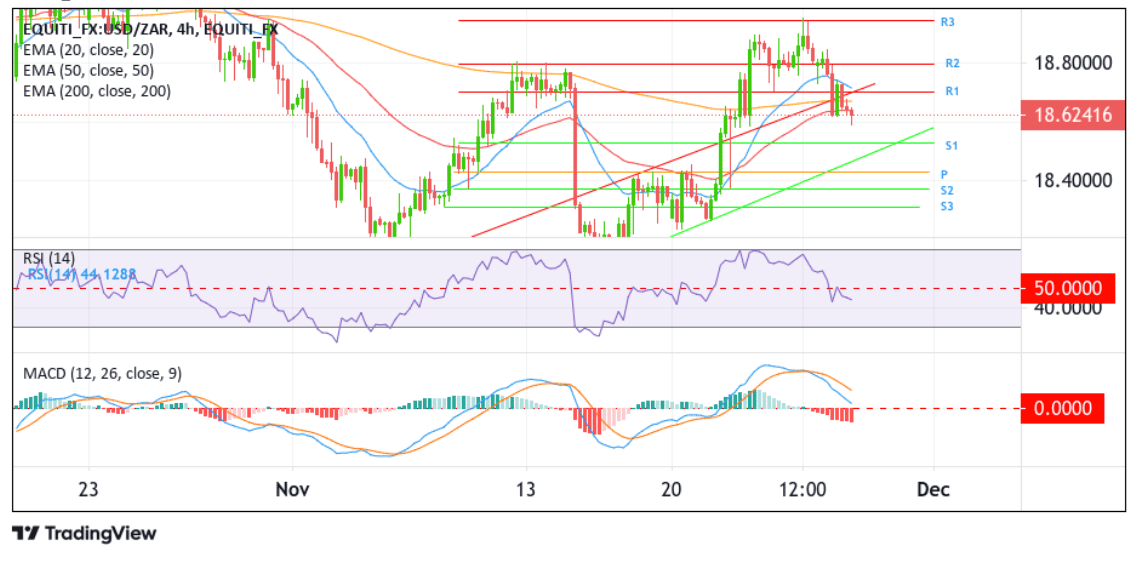
From a technical perspective, using a four-hour price chart, USD/ZAR confirmed a fresh price breakout below the key resistance level (now turned support level) on Monday. However, upon breaking below the aforementioned level, the bulls forced a bullish pullback above the support level. Still, they failed to gather enough momentum to push the price higher before sellers jumped in and retook over the mantle of the ship, forcing a move below the 200-day (EMA) day at 18.679 and a second bearish price breakout break below the key support level. Sellers, after that, pushed the price, and as of writing, the price is trading within striking distance of the 16.6000 mark. That said, if selling momentum increases beyond the current price level, USD/ZAR could weaken toward the 16.6000 mark, and if this level fails to defend itself, the shared currency could drop further toward the 18.532 support level (S1). A clean move below this level would see the USD/ZAR cross decline toward retesting the key support level plotted by an ascending trendline extending from the mid-November 2023 swing to lower lows. A subsequent break below this level would reaffirm the bearish thesis and pave the way for an accelerated drop toward the pivot level (P) at 18.433, corresponding to the 61.8% Fibonacci Retracement level (Golden Fib). A decisive move below this level would act as a fresh trigger for new sellers to jump in and spark an extended decline toward 18.372 (S2), followed by the 18.263 support level (S3).
On the flip side, if buyers resurface and spark a bullish turnaround, initial resistance comes in at the seller congestion zone due to the 50 (red) and 200 (yellow) days Exponential Moving Average (EMA) at the 18.638 and 18.679 levels, respectively. Suppose side-lined buyers join in from this zone. In that case, it will rejuvenate the bullish momentum, provoking an extended rally above the key support level plotted by an ascending trendline extending from the mid-November 2023 swing to higher highs (now turned resistance level) followed by the 18.701 barriers (R1) toward the 18.802 ceilings (R2). The trajectory could be extended toward the November 2023 record high at the 18.954 level in highly bullish cases.