US WTI Crude Oil Price Dips On Softer U.S. Dollar And Mixed Chinese Trade Balance Data


Key Takeaways:
- The US WTI crude oil price slipped further on Tuesday, weighed by a combination of factors
- Rebounding U.S. dollar and mixed Chinese trade balance data offset crude oil supply cuts
- Any escalation in the ongoing Israel-Hamas war could help limit downside moves around the precious black liquid

The U.S. West Texas Intermediate (WTI) crude oil ticked lower on Tuesday during the Asian session, weighed by rebounding U.S. dollar and weaker-than-expected Chinese trade balance data that has raised concerns over sluggish demand in the world's second-top oil importer. As of press time, the precious black liquid fell 44 cents (0.55%) to trade at $80.42 per barrel and has fully reversed Monday's oil rise from multi-month lows, buoyed by news of further commitments by Saudi Arabia and Russia to maintain their ongoing crude oil supply cuts until the end of the year. Moreover, crude oil received some intra-day boost on Monday after the U.S. announced plans to buy three million more barrels of oil to refill the Strategic Petroleum Reserve (SPR), leading to further tightness in crude oil supply.
However, these were offset by a surge in U.S. dollar demand witnessed since Monday, which weighed heavily on crude oil prices. In fact, the U.S. Dollar index (DXY), which measures the greenback against a basket of currencies, extended the modest bounce from the vicinity of the 104.853 level touched on Monday and was last seen trading in modest gains above the 105.300 mark on Tuesday during the Asian session as prospects for further policy tightening by the Federal Reserve (Fed) supported the modest bounce in U.S. Treasury bond yields, which extended support to the buck.
Reaffirming market bets that the Fed still needs to be done with hiking rates were the recent comments by Minneapolis Fed President Neel Kashkari, who warned that the central bank may not raise interest rates, given that inflation has remained sticky in recent months. While he acknowledged some resilience in the U.S. economy, he also noted that the Fed had more work to do regarding inflation.
Further weighing on crude oil prices was the mixed Chinese macro data released earlier today, which showed China's exports in U.S. dollar terms fell by 6.4% in October from a year ago. That's worse than the 3.3% drop predicted by a Reuters poll. However, imports rose 3% in U.S. dollar terms in October from a year ago. That's in contrast to Reuters' forecast for a 4.8% drop from a year ago. Nevertheless, the extended decline in exports indicated further challenges for China's primary economic drivers, potentially hindering the country's growth and contributing to additional decreases in oil demand.
That said, any escalation in the ongoing Israel-Hamas war could disrupt Middle Eastern supplies, which in turn would harm global crude oil supply and, hence, could help limit further downside moves around the precious black liquid.
From now on, oil traders look forward to releasing U.S. Trade balance data, highlighting the difference in value between imported and exported goods in October.
Technical Outlook: Four-Hour US WTI Crude Oil Price Chart
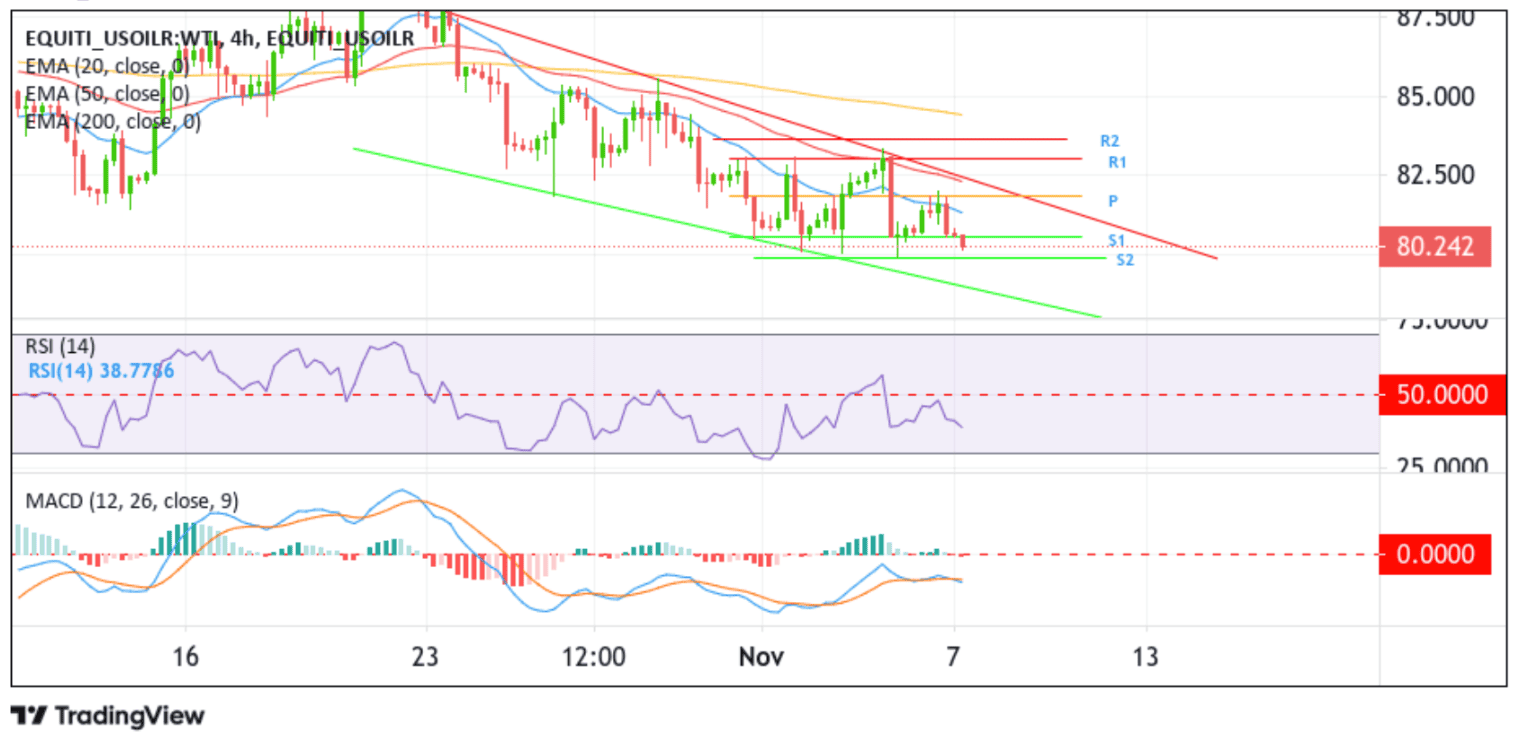
From a technical perspective, the US WTI crude oil price has been trading within a bearish channel for the last thirteen days and is currently 0.8% and 1.29% down for the week and month, respectively, with no apparent signs of bearish exhaustion. A further increase in selling momentum from the current price level will drag spot prices toward the 80.000 round mark, about which, if sellers find acceptance below this level, attention will shift toward the 79.921 floor. A clean break below this support level could see the precious black liquid accelerate its decline toward retesting the key support level (lower limit of the descending channel pattern) plotted by a downward-sloping trendline extending from the late-October 2023 swing lower-low. A subsequent break below this key level would reaffirm the bearish bias and pave the way for further sell-side moves.
All the technical oscillators (RSI (14) and MACD) on the chart are in dip-negative territory, suggesting continuing the bearish price action this week. Further supporting the bearish outlook is the acceptance of the price below the technically strong 200-day (yellow) Exponential Moving Average (EMA) at the 85.929 level. Additionally, the 50 (red) and 200 (yellow) day Exponential Moving Averages (EMA) crossover (golden cross) at 85.764 adds credence to the bearish bias.
On the flip side, if dip-buyers and tactical traders jump back in and trigger a bullish reversal, initial resistance appears at 80.487. If the price pierces this barrier, US WTI crude oil could ascend toward the key pivotal level (P) at 81.875. On further strength, the focus shifts to the key resistance level (upper limit of the descending channel pattern) plotted by a downward-sloping trendline extending from the late-October 2023 swing higher-high. A subsequent break above this support level could see the precious black liquid extend its bullish pullback toward confronting the 83.070 resistance level (R1), followed by the 83.319 resistance level (R2).