US30 Futures Index Extends Post-U.S. CPI-Inflicted Losses As Market Focus Shifts Toward PPI Data


Key Takeaways:
- The US30 futures index moved slightly lower on Friday during the Asian session, paring overnight gains
- Softer-than-expected U.S. inflation report cemented market expectations of an imminent pause in Fed rate hikes
- Walt Disney, Inc. (NYSE: DIS) and Goldman Sachs Group, Inc. (NYSE: GS) led the list of top gainers and top losers, respectively, before the bell
- The market shifts toward releasing the Producer Price Inflation (PPI) data report for July for fresh directional impetus
The Dow Jones futures index ticked slightly lower on Friday during the Asian session, paring the overnight gains as investors continued to assess the softer-than-expected U.S. inflation report and its implication on the Fed rate hike path.
As of press time, futures tied to the Dow Jones have lost 0.07%/23.92 points to trade at the $35188.20 level. The move follows a sharp rebound from the vicinity of the $35238.38 level touched earlier today, following an overnight rally from the vicinity of the $35124.34 level to close on Thursday with heavy losses just below the $35200.00 mark.
Furthermore, the moves follow a winning day on Wall Street, as the softer-than-expected U.S. inflation report cemented market expectations that the Federal Reserve (Fed) may refrain from tightening monetary policy further this year.
Following the positive report, Futures tied to the Dow Jones Industrial Average rose 122 points or 0.4%. S&P 500 futures and those connected to the Nasdaq-100 added 0.4% and 0.7%, respectively, before paring gains to move lower and close in modest losses on Thursday.
A U.S. Bureau of Labor Statistics report on Thursday showed that consumer-level inflation rose slightly in July to 3.2% from a year ago, beating market consensus of a 3.3% rise. Every month, inflation increased by 0.2%, in line with estimates. Excluding food and energy, the annual core consumer price inflation rate in the United States fell to 4.7% in July 2023, the lowest since October 2021, from 4.8% in the prior month and below market expectations of 4.8%. Every month, core consumer prices rose by 0.2% from a month earlier in July, the same as in June and line with expectations.
The softer inflation data report combined with July's jobs report released last Friday, which showed cooling signs of job growth but still pointed to a resilient labor market, have fueled market expectations of a soft landing shortly. CME's Fed Watch tool showed that Fed Fund Futures traders have now priced in an 89% chance that the Fed will keep its rates unchanged at 5.25% during the September FOMC meeting.
In other news, the number of Americans filing for unemployment benefits jumped by 21,000 from the prior week to 248,000 on the week ending August 5th, the highest in one month, sharply above expectations of 230,000. 
Gainers and Losers
Here are the top US30 Index movers today before the bell, a week in which the main index is set to close with heavy losses.
Top Gainers⚡
The top performers on the US30 Index were:
- Walt Disney, Inc. (NYSE: DIS) rose 4.88%/4.27 points to trade at $91.76 per share.
- Intel, Inc. (NASDAQ: INTC) added 1.17%/0.40 points to trade at $34.68 per share.
- Salesforce, Inc. (NYSE: CRM) gained 1.16%/2.39 points to trade at $208.25 per share.
Top Losers💥
The worst performers on the US30 Index were:
- Goldman Sachs Group, Inc. (NYSE: GS) lost 0.67%/2.29 points to trade at $340.40 per share.
- Nike, Inc. (NYSE: NKE) declined 0.60%/0.66 points to trade at $109.03 per share.
- Johnson & Johnson Inc. (NYSE: JNJ) shed 0.52%/0.90 points to trade at $172.17 per share.
Investors look forward to releasing the Producer Price Inflation data report for July, which is expected to show a slight increase in producer prices for final demand in the U.S. The essential data will influence the U.S. dollar's dynamics and provide directional impetus for the main index.
Technical Outlook: One-Day US30 Futures Index Price Chart
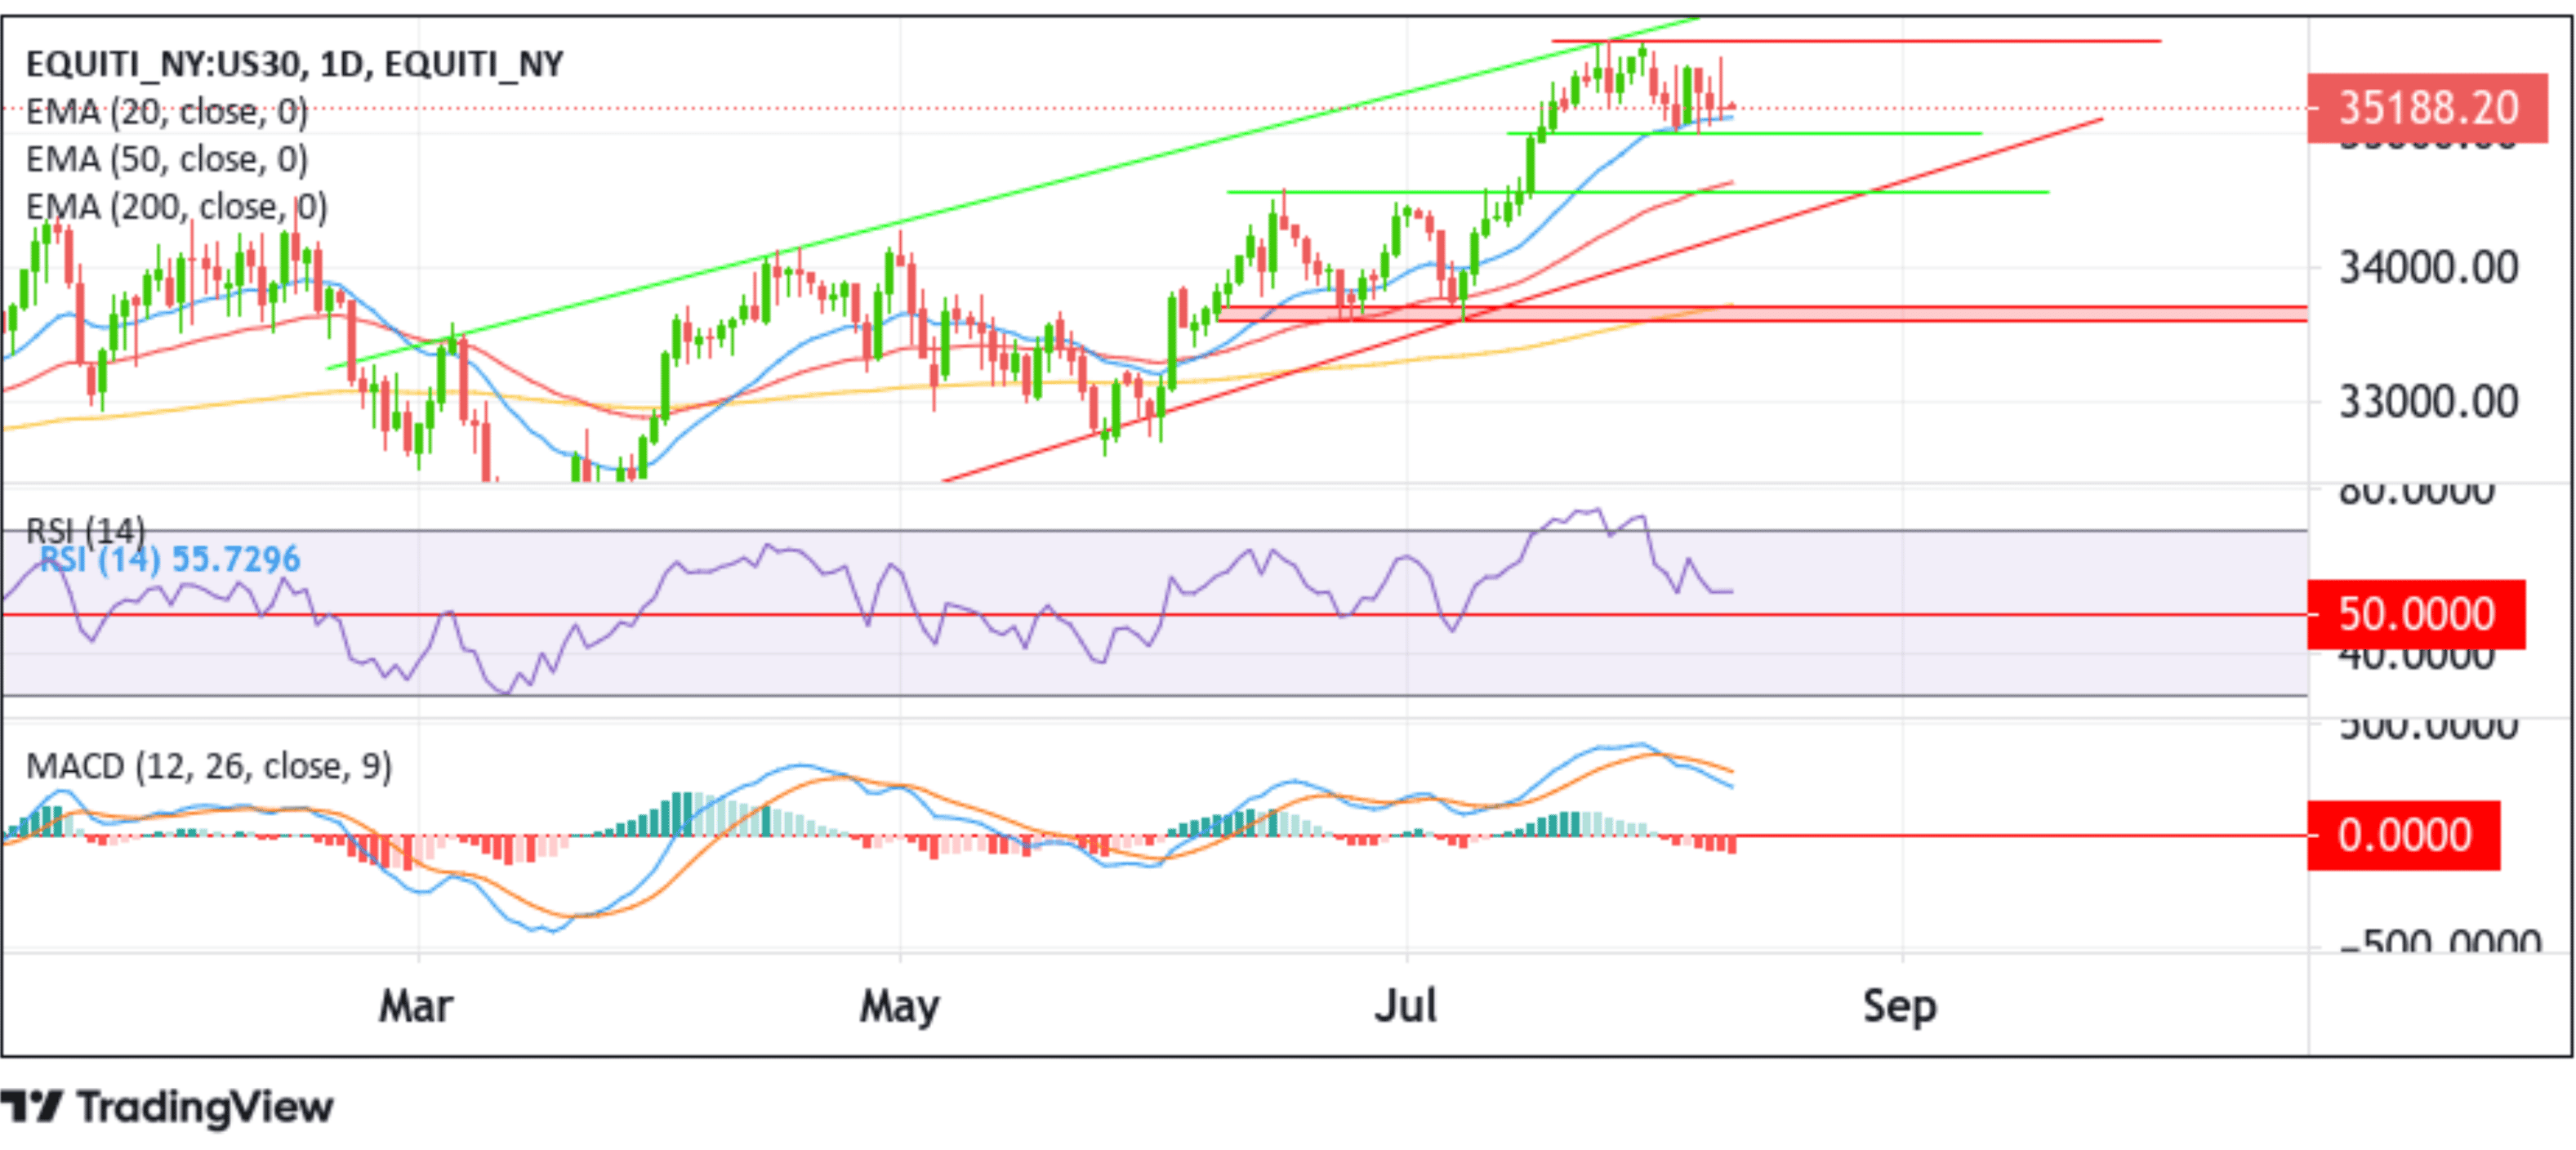
From a technical perspective, a further increase in selling momentum beyond the current price level will face initial resistance at the 20-day (blue) EMA level at 35120.38. Acceptance below this EMA level will pave the way for a drop toward the 34993.57 support level, below which the US30 futures index price could accelerate its decline toward the 50-day (red) EMA level at 34636.63, which sits above the 34591.38 support level. A convincing move below these barriers will pave the way for a further drop toward the ascending trendline, extending from the late-May 2023 swing low. A subsequent break below this support level will pave the way for a move toward the demand zone ranging from 33727.63 - 33604.12 levels. Noteworthy, the former level within the aforementioned zone coincides with the technically strong 200-day (yellow) EMA level, about which, if sellers manage to breach this zone, downside pressure could accelerate, paving the way for further losses around the main index.
On the flip side, the 35686.64 level now acts as an immediate hurdle, above which a bout of short-covering can lift the main index toward retesting the ascending trendline from the mid-April 2023 swing high. A one-day candlestick close above this level (bullish price breakout) will reaffirm the thesis and pave the way for further gains around the main index.

