GBP/USD Weakens Further Below 1.27000 Mark As Hotter U.S. PPI Data Overshadows Stronger U.K. GDP Data


Key Takeaways:
- GBP/USD pair witnessed selling on Monday and dropped further below the 1.27000 mark
- Rising Treasury bond yields, bolstered by hawkish Fed expectations, underpin the greenback
- Hotter-than-expected U.S. PPI data, to a greater extent, overshadows stronger-than-expected U.K. GDP data
- Focus shifts toward the U.K.’s wage report, U.S. Retail sales data, and FOMC Meeting minutes
GBP/USD cross witnessed fresh supply on the first day of the week and dropped below the 1.27000 mark during the Asian session, marking the fourth day of a negative move in the previous seven. The pair looks set to maintain its bid tone heading into the European session amid sustained U.S. dollar buying.
Speculation that the Federal Reserve (Fed) will lift its Fed Fund rates one last time before pivoting remains supportive of rising treasury bond yields, which in turn supports prospects for the emergence of further buying around the U.S. dollar, which turns out to be a key factor weighing on the GBP/USD cross.
The bets were lifted after a U.S. Bureau of Labor Statistics (BLS) report released last Friday showed U.S. overall inflation rose more than expected in July, reversing a year-long cooling trend. The Producer Price Index (PPI), which measures the change in the price of goods sold by manufacturers, rose 0.3% month-over-month in July 2023, the most significant increase since January and above market forecasts of 0.2%. It follows a downwardly revised flat reading in June. Year-on-year, the PPI went up 0.8%, higher than 0.2% in June and forecasts of 0.7% amid base effects.
The hotter-than-expected PPI data came a day after another BLS report showed that consumer-level inflation rose slightly in July, supporting the case for a Fed pivot. However, the stronger PPI numbers, combined with July’s jobs report released earlier this month, have to a greater extent, reversed hopes that the Federal Reserve may refrain from tightening monetary policy further this year. Additionally, an Advance US Gross Domestic Product (GDP) report released early this month pointed to a highly resilient economy, supporting prospects for further tightening by the Fed.
Shifting to the U.K. docket, preliminary estimates showed that an Office for National Statistics (ONS) report released last Friday showed the British economy expanded 0.2% on quarter in Q2 2023, following a 0.1% growth in Q1 and beating forecasts of a flat reading. It follows a monthly GDP contraction of 0.1% in May and an increase of 0.2% in April. However, the strength of the June rise was partially attributed to warm weather and the additional public holiday in May to celebrate the coronation of King Charles III.
To a greater extent, the data squashed the narrative that the U.K. will fall into a recession later this year, with experts now projecting a mild recession mid-next year. The Bank of England (BoE) will look at the GDP report combined with other key macroeconomic data in the coming weeks to determine the following path of rate hikes. Nevertheless, the U.K. Central Bank is expected to raise interest rates from 5.25% to 5.50% in September as U.K. inflation remains exceptionally high at 7.9%.
As we advance without significant economic news data from both dockets, the broader market risk sentiment and U.S. Treasury bond yields will continue to influence the U.S. dollar and provide short-term trading opportunities around the USD/JPY pair. The focus, however, remains on the U.K. Average Earnings Index + Bonus data report for June and the U.S. Retail sales data, plus the Fed’s FOMC Meeting Minutes, all set for release later in the week.
Technical Outlook: Four-Hours GBP/USD Price Chart
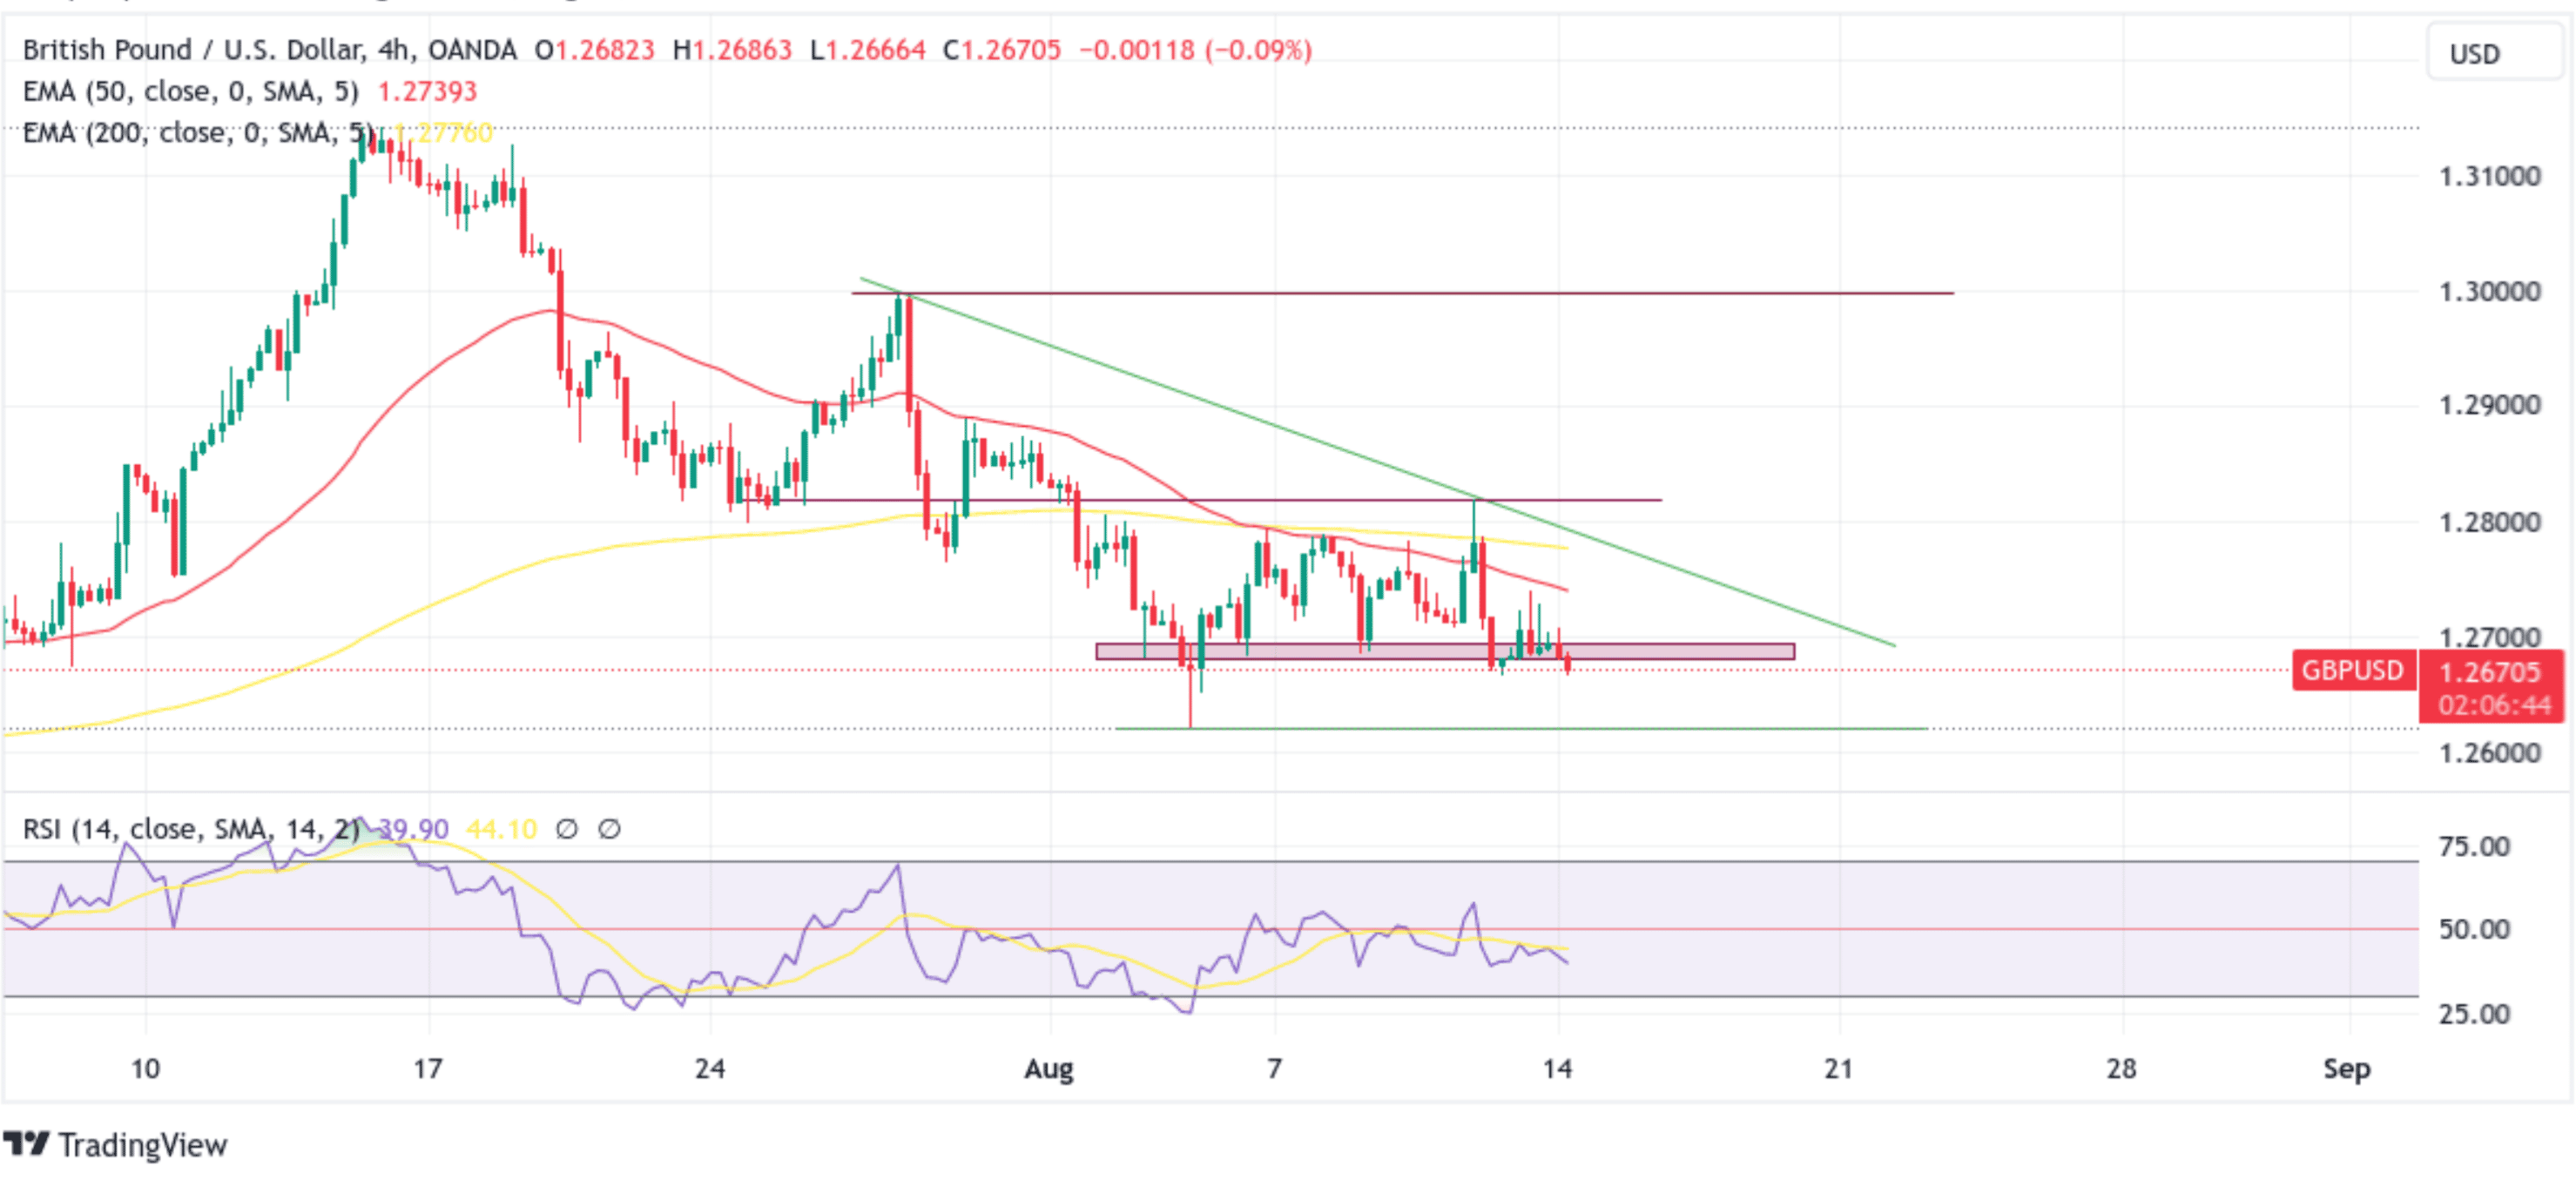
From a technical standpoint, the price’s ability to find acceptance below the demand zone ranging from 1.26942 - 1.26800 levels supported the case for further downside moves. Some strong follow-through selling from the current price level would drag spot prices toward the 1.26194 support level. If sellers manage to breach this key floor, downside pressure could accelerate further, paving the way for a drop toward the 1.25924 key support level, and in highly dire cases, the bearish trajectory could be extended toward the 1.25000 round mark.
On the flip side, if buyers resurface and spark a bullish turnaround, initial resistance comes in at the 50-day (red) EMA level at 1.27368. Acceptance above this barrier will pave the way for an ascent toward the technically 200-day solid (yellow) EMA level at 1.27767. A convincing move above this EMA level will negate any near-term bearish outlook and pave the way for aggressive technical buying around the GBP/USD pair. The bullish uptick could be extended above the downward-sloping trendline toward the 1.29991 resistance level.