AUD/USD Sticks To Gains Above 0.65000s As Bulls Eye To Recover More Lost Ground In The Back Of A Weaker U.S. Dollar, All Eyes On U.S. QoQ (Q1) GDP Data


Key Takeaways:
- AUD/USD remains capped above 0.65000 round mark supported by a combination of factors.
- A fresh batch of disappointing U.S. macrodata combined with easing tensions in the Middle East undermines further the greenback and helps cap the downside for the AUD/USD pair.
- Signs that the RBA could be forced to maintain its restrictive monetary policy and delay cutting rates lend further support to the antipodean.
- Markets focus shift toward the release of the U.S. GDP (QoQ) (Q1) data report for fresh AUD/USD directional impetus
AUD/USD pair prolonged its recent strong move up over the past one week and gained positive traction for the fourth successive day on Thursday. As per press time, the shared currency is up over five pips for the day and trading at the $0.65037 level, just a few pips above the $0.65000 round mark. The pair looks set to build upon its offered tone heading into the European session.
A weaker U.S. dollar across the board has been acting as a tailwind to the AUD/USD pair and helped keep the shared currency under bullish pressure amid the risk-averse. This comes amid easing tensions in the Middle East that saw investor scale back their bullish bets around safe-haven assets in favor of risk-perceived assets benefiting the antipodean.

Additionally, a fresh round of disappointing U.S. macrodata also turns out to be another factor weighing down on the safe-haven buck and helping cap the downside for the AUD/USD cross.. New orders for non-defense capital goods excluding aircraft, a closely monitored proxy for business spending plans, rose by 0.2% in March, following a revised 0.1% decrease in February but came below market expectations of a 0.3% increase.
Apart from this, the risk-off mood ahead of key U.S. GDP (QoQ) (Q1) and Core PCE Price Index data reports later today and tomorrow continues to undermine the greenback and has assisted the AUD/USD cross in attracting further buying at higher levels.
Moreover, signs that the Reserve Bank of Australia (RBA) could be forced to maintain its restrictive monetary policy and delay cutting rates lend further support to the antipodean. This comes after Australia's inflation rate fell to 3.6% yoy in Q1 of 2024, down from 4.1% in the prior period but above market expectations of 3.4%, according to a report by the Australia Bureau of Statistics released on Wednesday. Meanwhile, the RBA's trimmed mean CPI increased by 4.0% yoy, the softest rise in two years, but remained outside the central bank's target range of 2-3%.

That said, the fundamental backdrop still favors the bears as the greenback continues to draw support from firm hawkish Fed expectations that the Fed will delay cutting rates and prolong its hawkish stance through 2024.
This comes amid robust US economic indicators alongside assertive remarks from multiple Federal Reserve officials in recent weeks. Markets are now anticipating the first rate cut to come in July or September rather than June, CME’s Fed Watch tool now shows.
Going forward investors look forward to the U.S. docket featuring the release of the Initial Jobless Claims(previous week), Goods Trade Balance (Mar), and the Pending Home Sales (MoM) (Mar) data reports. The main focus however remains on the release of the Quarter One GDP data report which is expected to show the U.S. economy contracted in quarter one 2024 by 2.5% from 3.4% the previous quarter.
Technical Outlook One-Day AUD/USD Price Chart
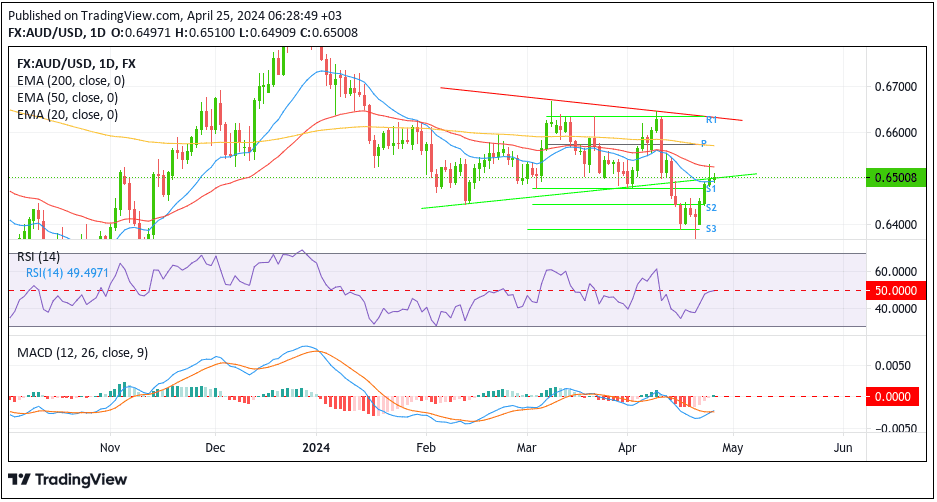
AUD/USD’s one-day price chart shows the major currency pair has made a huge comeback in the last four days following a heavy sell-off from early this month till mid-this month. Spot prices are currently placed above the lower limit of a rising wedge chart pattern extending from the mid-February 2024 swing lower-lows (key support level now turned resistance level), which supports the case for further upside moves. Above the current price level, the 50-day (red) EMA level at 0.65254 level now seems to act as an immediate hurdle, about which, if the price finds acceptance above this hurdle, price could rise further to tag the technically strong 200-day (yellow) EMA level at 0.65636 level. A convincing move above this level will negate the current bearish bias and pave the way for a sustained rise toward the 0.66000 round mark en route to the key resistance level (upper limit of a rising wedge chart pattern extending from the early-March 2024 swing higher-highs.
Conversely, if dip-sellers and tactical traders return and spark a bearish reversal, initial support comes in at the 0.64777 level (S1). On further weakness, prices could drop toward the 0.64426 support level (S2), about which, if this level fails to hold, the price could accelerate its fall toward the 0.63883 level (S3), and in worst-case scenario fall toward the 0.63000 round mark.