US WTI Crude Oil Sinks Below $70.00 A Barrel As U.S. Debt Deal And Weak Chinese Data Weighs


- US WTI crude oil futures dipped below $70.00 a barrel on Wednesday, weighed down by various factors
- A fresh round of weak Chinese data worsened concerns over global oil demand
- Oil prices might find a reprieve if incoming U.S. data match market expectations

US WTI crude oil futures extended their modest decline for the second successive day on Wednesday as crude oil prices ticked further below $70 per barrel during the Asian session, weighed down by the debt ceiling talks, disappointing Chinese macro data, and mixed messages from oil producers that threatened to disrupt the supply outlook. As per press time, US WTI futures were down 28 cents/0.40% for the day, trading at $69.279 per barrel after initially rebounding in the previous session by 32 cents/0.45% to close at $69.49 per barrel on Monday. Brent crude futures, on the other hand, as per (06:00 UTC+3), were also down 19 cents/0.26% to trade at $73.52 per barrel.
Uncertainty concerning the deal agreed upon over the weekend during the debt ceiling talks between President Joe Biden and House Speaker Kevin McCarthy continues to cloud oil markets. It is seen as a key factor exerting downward pressure on crude oil prices as the deal is yet to face a vote before Congress later today, of which a possible outcome is still unknown. A new development from the debt ceiling talks in which a handful of hard-right Republican lawmakers said they would oppose a deal to raise the United States' $31.4 trillion debt ceiling further exacerbated the U.S. debt default narrative, which saw investors shy away from risk-perceived assets in favor of traditional safe-haven assets and turn acted as a headwind for crude oil prices.

Despite that, President Joe Biden and House Speaker Kevin McCarthy are confident they will get enough votes for the deal to pass once it gets submitted to Congress for a vote later today. Noteworthy, the debt ceiling deadline comes days before the OPEC meeting slated for June 4th as the oil-producing countries are set to meet to discuss its production plans. Over the weekend, Saudi Arabia, the world's top exporter and a member of the OPEC+ group, dropped hints through its Energy Minister, Prince Abdulaziz bin Salman, that it could once again cut production further, which in turn further contributed to the negative sentiment around oil prices. However, repeated comments from top Russian officials indicate the world's third-largest oil producer is leaning toward leaving production unchanged.
Further contributing to the sentiment around crude oil prices was the fresh round of negative Chinese macro data, which cast doubt on the world's top importer's post-Covid rebound and worsened concerns over global oil demand. The Chinese manufacturing sector contracted for the second straight month amid weak domestic and global demand as the official NBS Manufacturing PMI unexpectedly fell to a five-month low of 48.8 in May 2023 from 49.2 in April, missing market estimates of 49.4. Additionally, the Chinese Non-Manufacturing PMI and Composite PMI data for May all fell to near contraction levels, landing at 54.5 and 52.9, respectively, down from 56.4 and 54.4 in the previous month.

Additionally, a generally strong U.S. dollar continues to undermine crude oil prices amid firm market expectations that the Federal Reserve (Fed) will continue to raise interest rates. The bets were further boosted after the latest U.S. core PCE inflation readings showed inflation remained sticky in the U.S. despite increased interest rates.
A fresh round of positive U.S. macro data on Tuesday also offered the greenback some intraday boost, which saw the mighty buck close in modest gains during the New York session on Tuesday. Consumer sentiment in the U.S. weakened slightly in May to 102.3, down from 103.0 in April but above market expectations of 99.0, a U.S. Conference Board report revealed on Tuesday. Further lifting the greenback was the Standard & Poor's report on Tuesday, which showed the S&P CoreLogic Case-Shiller 20-city home price index in the U.S. fell 1.1% yoy in March 2023, the first decline since May 2012, and compared to forecasts of a 1.6% drop.
As we advance, incoming U.S. data this week is expected to show the U.S. manufacturing sector contracted this month, the unemployment rate rose this month, and the number of jobs created dropped from last month. This, in turn, might hold investors back from placing aggressive bearish bets and encourage them to wait for near-term appreciating moves before placing fresh bearish bets.
Technical Outlook: Four-Hours US WTI Crude Oil Futures Price Chart
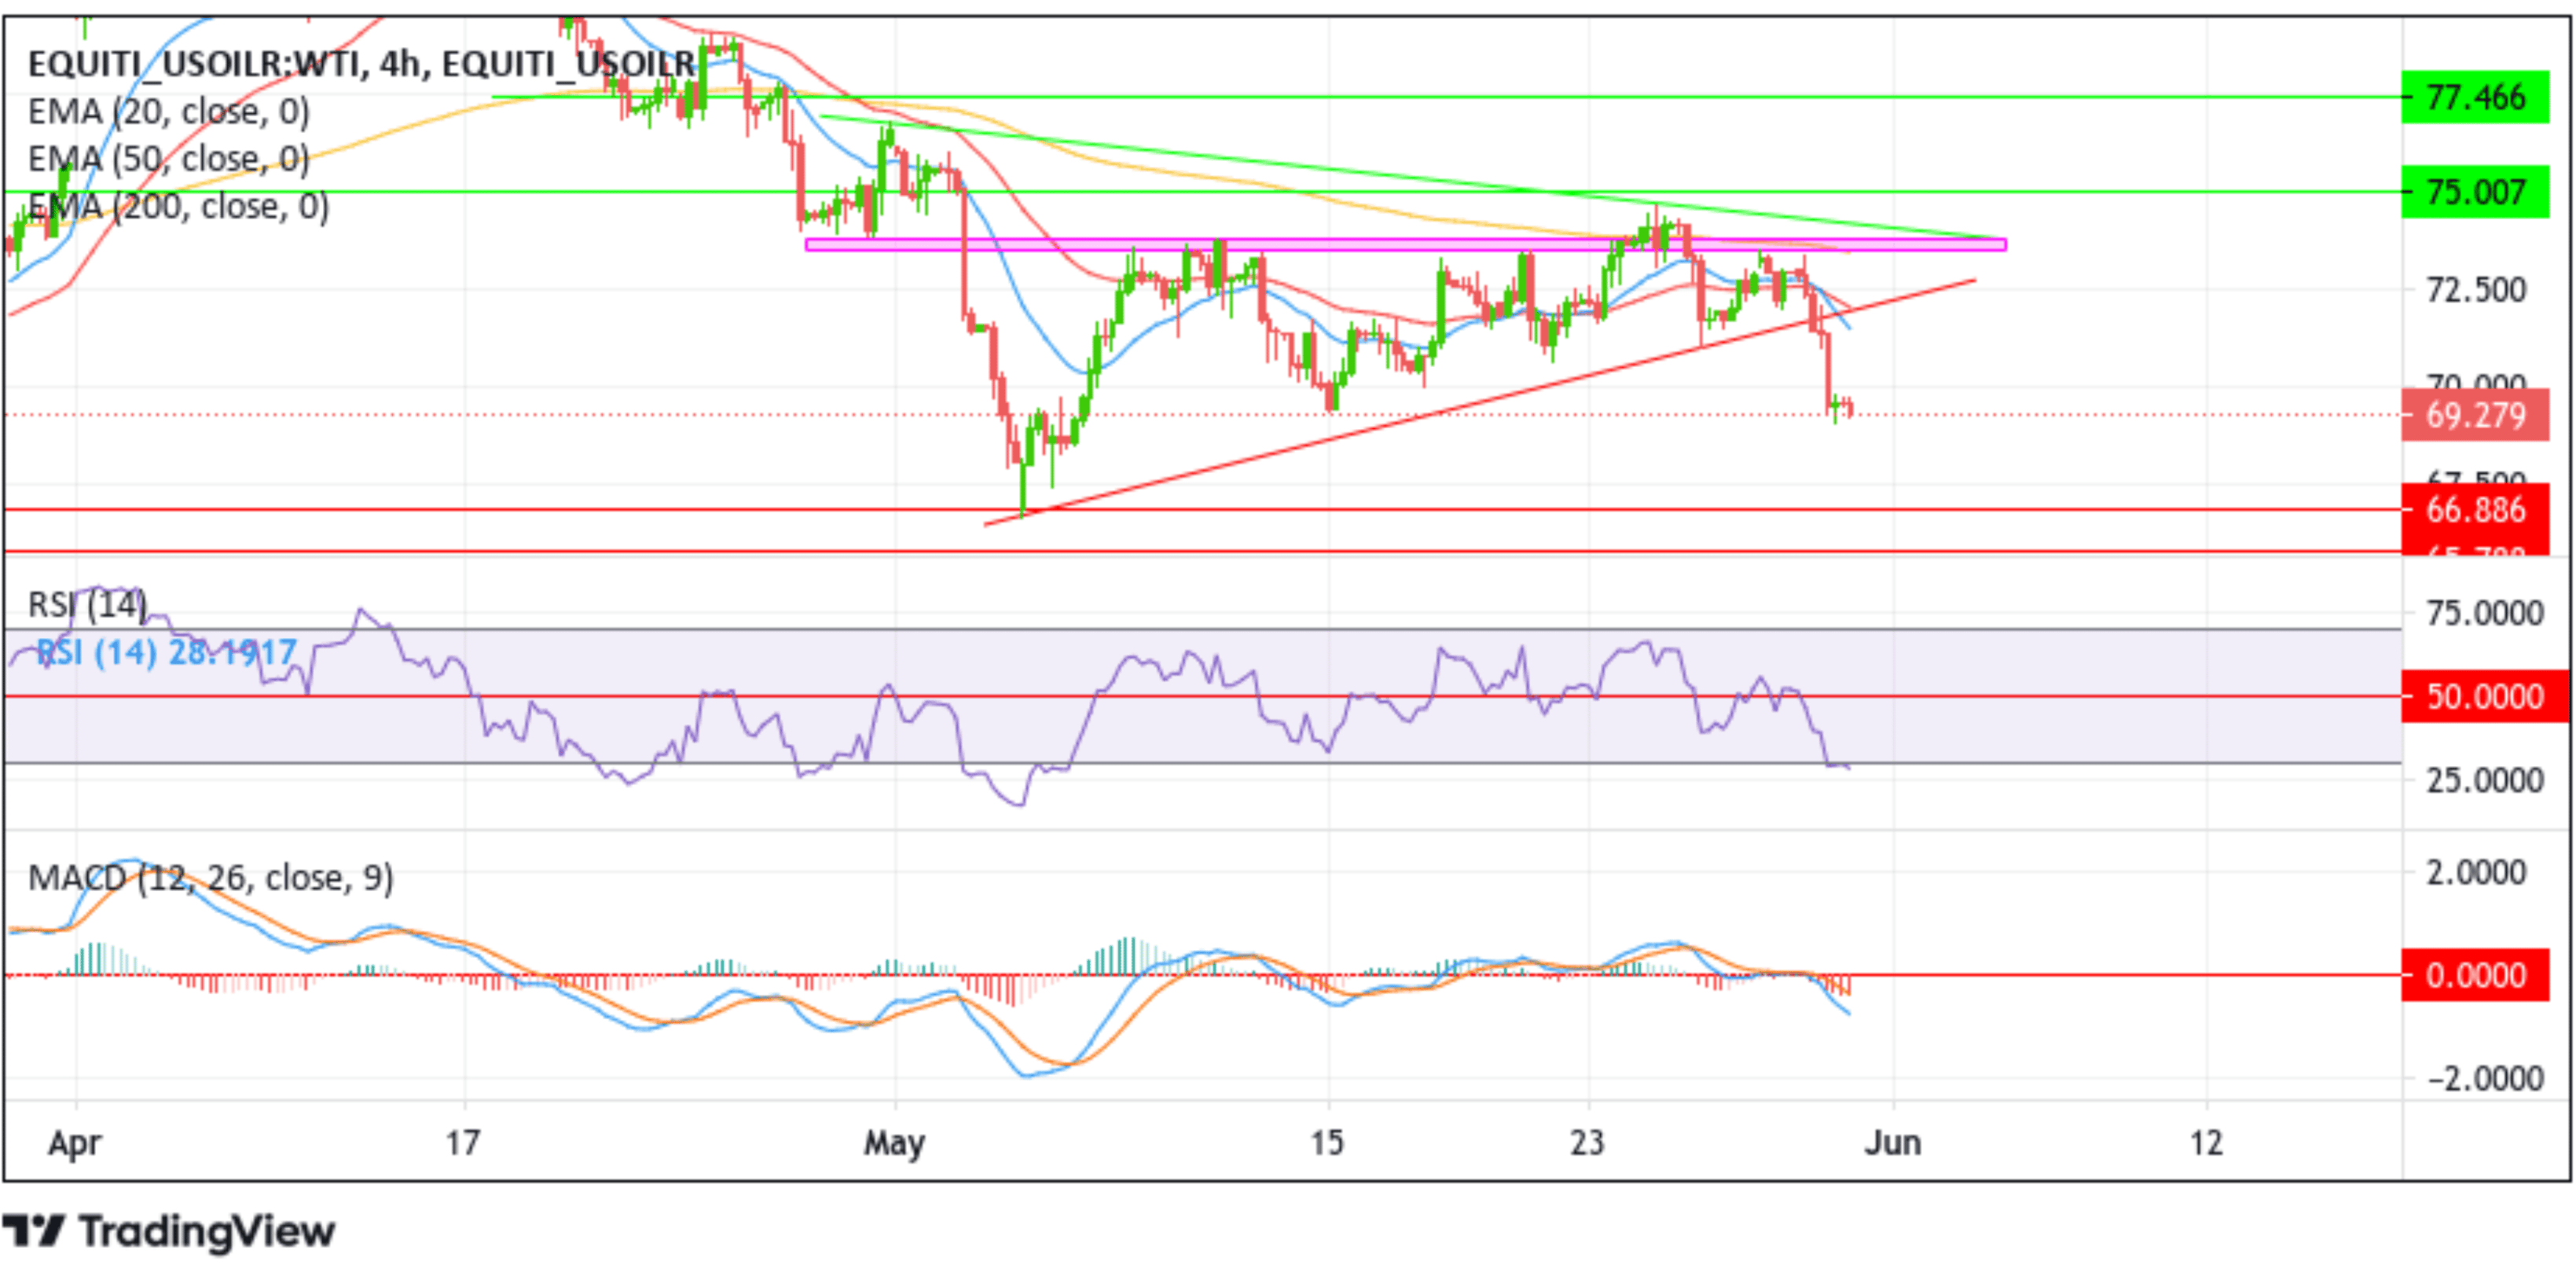
From a technical standpoint, the price's ability to break below the key support level plotted by an ascending trendline extending from the early-May 2023 swing low supported the case for further southside moves. Apart from this, price acceptance below the technically strong 200-day (yellow) Exponential Moving Average (EMA) at the $77.626 level, followed by the 200 (yellow) and 50 (red) days EMA crossover at 77.466 further added credence to the bearish outlook. That said, further sales momentum would drag spot prices to the immediate support at the $69.339 level. If sellers manage to breach this floor, downside pressure could accelerate, paving the way for a drop toward the $66.886 support level. The focus on further weakness shifts toward the $65.788 support level.
All the technical oscillators on the chart are in negative territory, suggesting the continuation of the bearish price action this week. However, the RSI (14) oscillator at 28.1917 is flashing oversold conditions warranting caution to traders against submitting aggressive bearish bets and waiting for near-term bullish moves before placing fresh bearish bets in favor of the bearish trend.
On the flip side, if buyers resurface and spark a bullish turnaround, initial resistance comes in at the 20-day (blue) and 50-day (red) EMA levels at $71.308 and $71.966, respectively. The latter coincides with the trendline support now turned resistance level, of which, if sidelined buyers join in from this seller congestion zone, it will rejuvenate the bullish momentum, provoking an extended rally toward the supply zone ranging from $73.774 - $73.493 levels. Sustained strength above this zone would pave the way for a short rally toward retesting the key resistance level plotted by a descending trendline extending from the late-April 2023 swing high.