Trading Indicator Basic: Volatility Trading


In trading, volatility refers to a statistical measure of the degree of variation or dispersion of returns for a financial asset or market index over a certain period. It is commonly used as an indicator of risk, with higher volatility indicating a greater potential for price fluctuations, both up and down, and lower volatility, meaning more price stability.
In forex trading, volatility is considered an essential factor for traders when determining the risk associated with a currency pair and further proving critical towards traders' profitability. It is, therefore, crucial to understand how relevant volatility is and how to trade it through different indicators.

What is Volatility Trading
Volatility trading involves taking positions in financial instruments to profit from changes in their volatility. This can include buying or selling options, trading futures contracts, or using other derivatives sensitive to market volatility changes. The goal of a volatility trader is to capture price movements driven by shifts in market sentiment, uncertainty, or other factors that can cause volatility to spike or drop. Successful volatility traders can profit from both rising and falling markets as long as they correctly anticipate changes in volatility levels.
How To Use Volatility In Trading
Traders can find volatility to be a valuable resource as it offers insights into the risk and return of a specific financial asset. An in-depth comprehension of volatility can help develop suitable trading strategies enabling traders to maximize profit potential. There are several ways to do this, such as trading in volatile assets like the Vix, monitoring variations in volatility to assist in making informed decisions, utilizing volatility-based technical indicators or software, or identifying volatility in ordinary markets, especially in fast-paced and high-yielding market movements.

Volatility Trading Strategies
Volatility trading strategies aim to profit from the fluctuations in the price of an underlying asset. Here are a few common volatility trading strategies:
1. Straddle
This involves buying a call option and a put option on the same underlying asset with the same strike price and expiration date. The strategy is profitable if the underlying asset's price moves significantly in either direction.
2. Strangle
Like the straddle, this involves buying a call option and a put option on the same underlying asset but with different strike prices. The strategy is profitable if the price of the underlying financial asset moves significantly but in either direction.
3. Condor
This more complex strategy involves selling both a call option and a put option with a higher and lower strike price than the underlying asset's current price. In addition, a trader would buy a call option and a put option with even higher and lower strike prices, respectively, to limit potential losses. The strategy is profitable if the underlying asset remains within a specific price range.
4. VIX Trading
The VIX index measures the implied volatility of the S&P 500 index. Some traders use VIX futures or options to trade the market's expected volatility. This is a more advanced strategy, as it involves trading on the volatility of an index rather than a specific asset.
Three Most Common Volatility Trading Indicators
Bollinger Bands Indicator
Bollinger bands is a popular volatility trading indicator based on the principle that prices tend to stay within a specific range, or band, around a moving average. The bands are plotted as two standard deviations from a simple moving average, visually representing a price range.
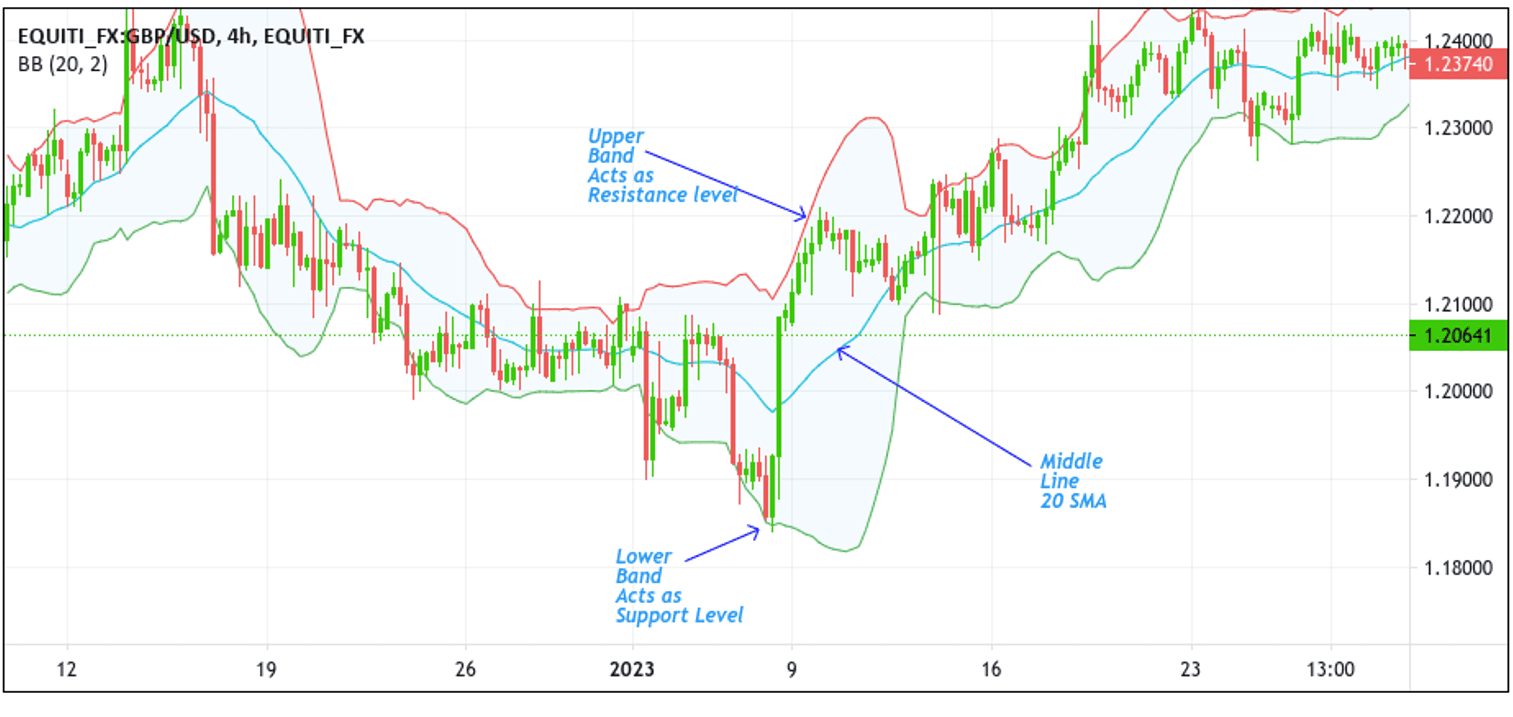
It consists of three lines that are plotted on a price chart. The middle line is a simple moving average (SMA), typically set at 20 periods but can be adjusted to suit the trader's preferences. The upper and lower bands are calculated by adding and subtracting a specified number of standard deviations (usually two) from the SMA. This creates a range of prices the market is expected to stay within, with the upper and lower bands acting as resistance and support levels, respectively.
Additionally, it can be used to identify overbought and oversold conditions in the market. When prices are at the upper band, it is considered overbought, and a potential reversal may be imminent. Conversely, when prices are at the lower band, it is considered oversold, and a possible rebound may be expected.
Relative Volatility Index(RVI) Indicator
The Relative Volatility Index (RVI) is a technical indicator based on the concept that volatility tends to be mean-reverting, meaning it typically oscillates around a certain level over time.
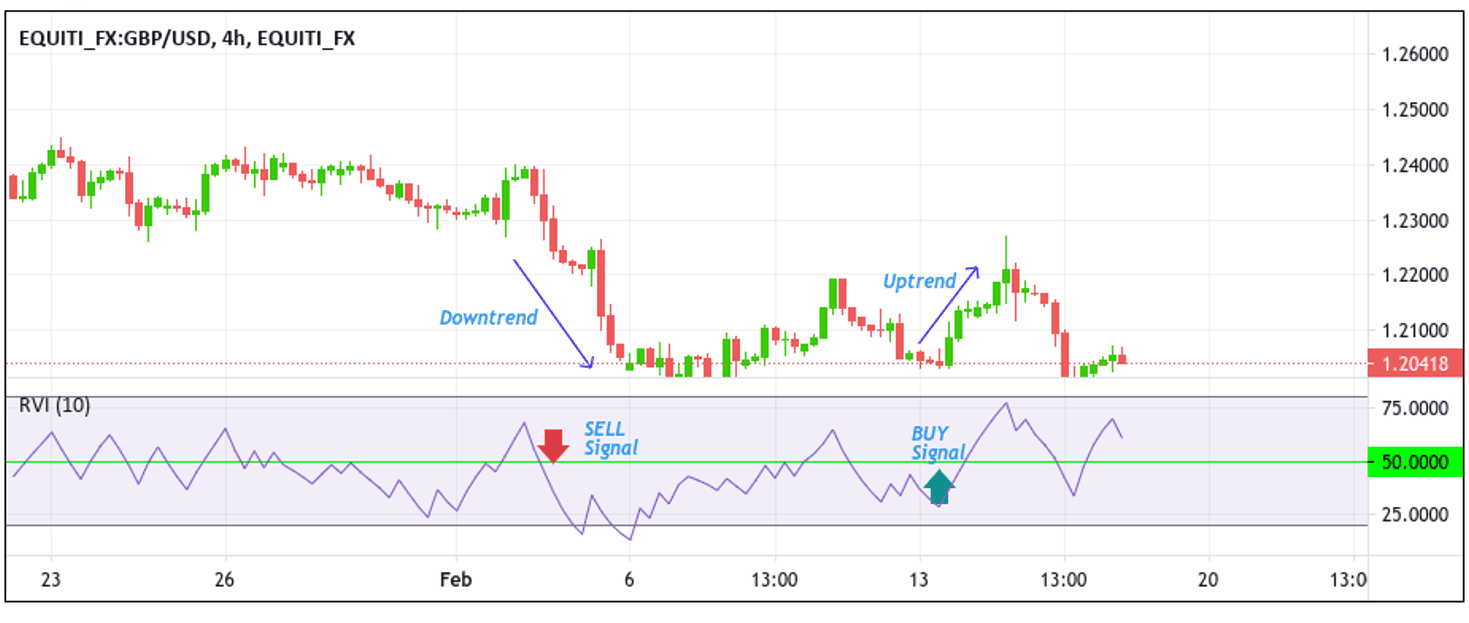
As a volatility trading indicator, the RVI can be used to identify potential trading opportunities based on changes in volatility. For example, a high RVI reading could indicate that the market is becoming more volatile, which may present options to enter or exit trades. Conversely, a low RVI reading could suggest that the market is relatively stable, which may prompt traders to adopt a more conservative approach.
Furthermore, traders can use the RVI indicator to spot trade entries; for instance, If the indicator surpasses the 50 levels, this indicates that there is an increase in volatility. Conversely, if it falls below 50, it shows a decrease in volatility. As a result, when a buy signal is detected, it is reinforced if the indicator is above or moving beyond 50. On the other hand, if a sell signal appears, it is strengthened if the indicator is below or moving below 50.
Standard Deviation Indicator
Forex trading is often used to identify periods of high and low volatility in the market. When the market is experiencing high volatility, the standard deviation will increase, and when the market is experiencing low volatility, the standard deviation will decrease.
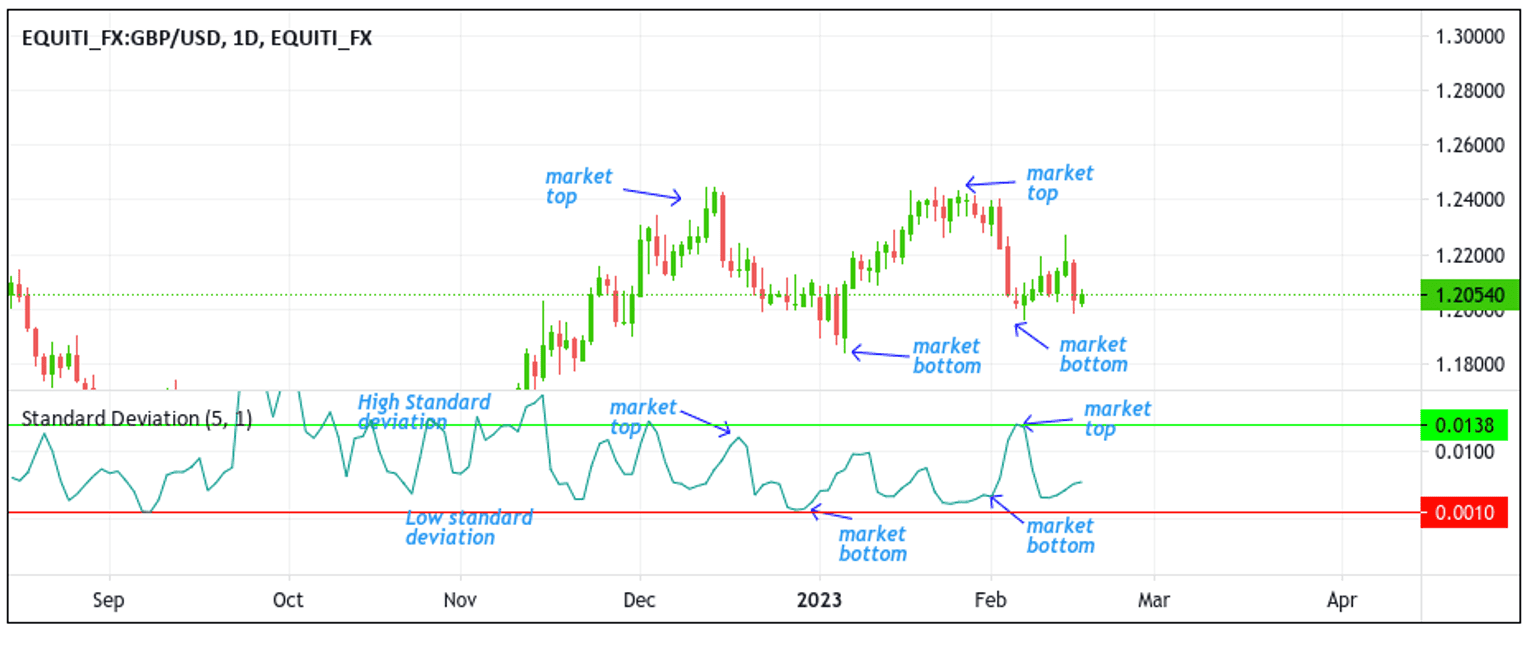
Traders often use the standard deviation indicator to identify potential market tops and bottoms. When the standard deviation is high, it indicates a lot of uncertainty and potential for significant price movements, which may signal a market top. Conversely, when the standard deviation is low, it suggests that the market is relatively stable, which may signal a market bottom. In short, the market tops and bottoms can be interpreted by traders as major price reversal points.
Additionally, Traders can use the standard deviation indicator to set stop-loss orders or take-profit targets. For example, a trader may place a stop-loss order below a recent low when the standard deviation is high, indicating that the market will likely experience large price movements.
Principles To Consider For Volatility Trading
When considering volatility trading, it's essential to keep in mind the following principles:

💡 Understanding the underlying asset:
Before trading volatility, it's crucial to deeply understand the asset or assets being traded, including their historical volatility patterns and the drivers of volatility.
💡 Using appropriate risk management techniques:
Volatility trading can be highly risky, and using appropriate risk management techniques, such as stop-loss orders and position sizing, to manage risk is essential.
💡 Considering implied versus historical volatility:
Implied volatility is the market's expectation of future volatility, while historical volatility measures past volatility. Understanding the relationship between these two measures are essential for volatility trading.
💡 Considering the term structure of volatility:
The term structure of volatility refers to the relationship between the implied volatility of options with different expiration dates. Understanding the term structure of volatility can help traders identify opportunities for trading volatility.
💡 Being aware of market events and news:
Market events and news, such as earnings reports, economic data releases, and geopolitical developments, can impact volatility. Awareness of these events and their potential impact on volatility is essential for traders.
In conclusion, volatility trading is a complex but rewarding trading strategy that involves profiting from changes in the level of volatility in financial markets. Volatility trading requires a deep understanding of the underlying financial asset and its associated risks and sophisticated mathematical models and risk management techniques, such as diversification and position sizing, to manage a trader's exposure to volatility.

Are you looking to add the Volatility trading strategy as part of a range of forex trading strategies you can use? You can Enjoy FREE USD 10,000 Virtual Funds for trading using the volatility trading strategy by Signing Up on the Pocket Trader website. With Pocket Trader, You can invest in multiple markets, including forex, indices, and commodities, learn from experienced traders and share ideas through pocket-trader's social features to build wealth together.