US WTI Crude Oil Retreats From Fresh Record High, Further Downtick Seems Elusive Amid Further Oil Cuts Pledge


- US WTI, crude oil price, takes a breather from a seven-week high and moves back below the 83.00 mark
- Saudi Arabia and Russia's decision to extend supply cuts through September continues to underpin crude oil prices
- Solid wage gains and a decline in the unemployment rate in the U.S. point to tight labor market conditions, which in turn weighs on crude oil price
US WTI crude oil price on Monday during the early Asian session rose to one of its best days this year, touching its highest level since mid-April before paring gains later in the session. The precious black liquid managed to record a seventh-consecutive week of increases buoyed by supply concerns after top oil producers Saudi Arabia and Russia pledged to extend supply cuts through September to tighten global markets further and support prices.
As per press time, the U.S. West Texas Intermediate crude futures price is now down 0.05%/4 cents to trade at $82.74 a barrel after hitting its highest level since mid-April/$83.26 earlier in the session.
Saudi Arabia on Thursday announced it would extend its unilateral production cut of 1 million barrels a day into September, the same as in August while pledging
the move can be extended or extended and deepened.
At the same time, Russia announced it would continue voluntarily reducing its oil supply in September by 300,000 barrels per day, compared to a 500,000 barrels a day cut in August.
Commenting on the moves, "With the production cut extended, we anticipate a market deficit of more than 1.5 million barrels per day (bpd) in September, following an estimated deficit of around 2 million bpd in July and August," UBS analysts wrote in a note. Further supporting the crude oil price rally was the U.S. Energy Information Administration (EIA) report last week on Wednesday, which showed U.S. crude inventories fell by a record 17 million barrels the previous week due to increased refinery runs and strong crude exports but at 439.8 million barrels, inventories are only 1% below the five-year average for this time of the year.
That said, crude oil prices continue to be weighed by data on Friday, which showed the U.S. economy created fewer jobs last month than markets expectations. However, robust wage increases and a decreased unemployment rate indicated that labor market conditions remained constrained.
Additionally, concerns about a subdued recovery in China and a downturn in eurozone business activity continue to weigh on crude oil prices. Apart from this, last week, the Bank of England's decision to raise rates to a record 15-year high also continues to weigh on crude oil prices.
As we advance this week, investors will closely monitor Chinese economic data to assess Beijing's inclination towards implementing additional stimulus measures to bolster the world's second-largest economy.
Technical Outlook: One-Day US WTI Crude Oil Price Chart
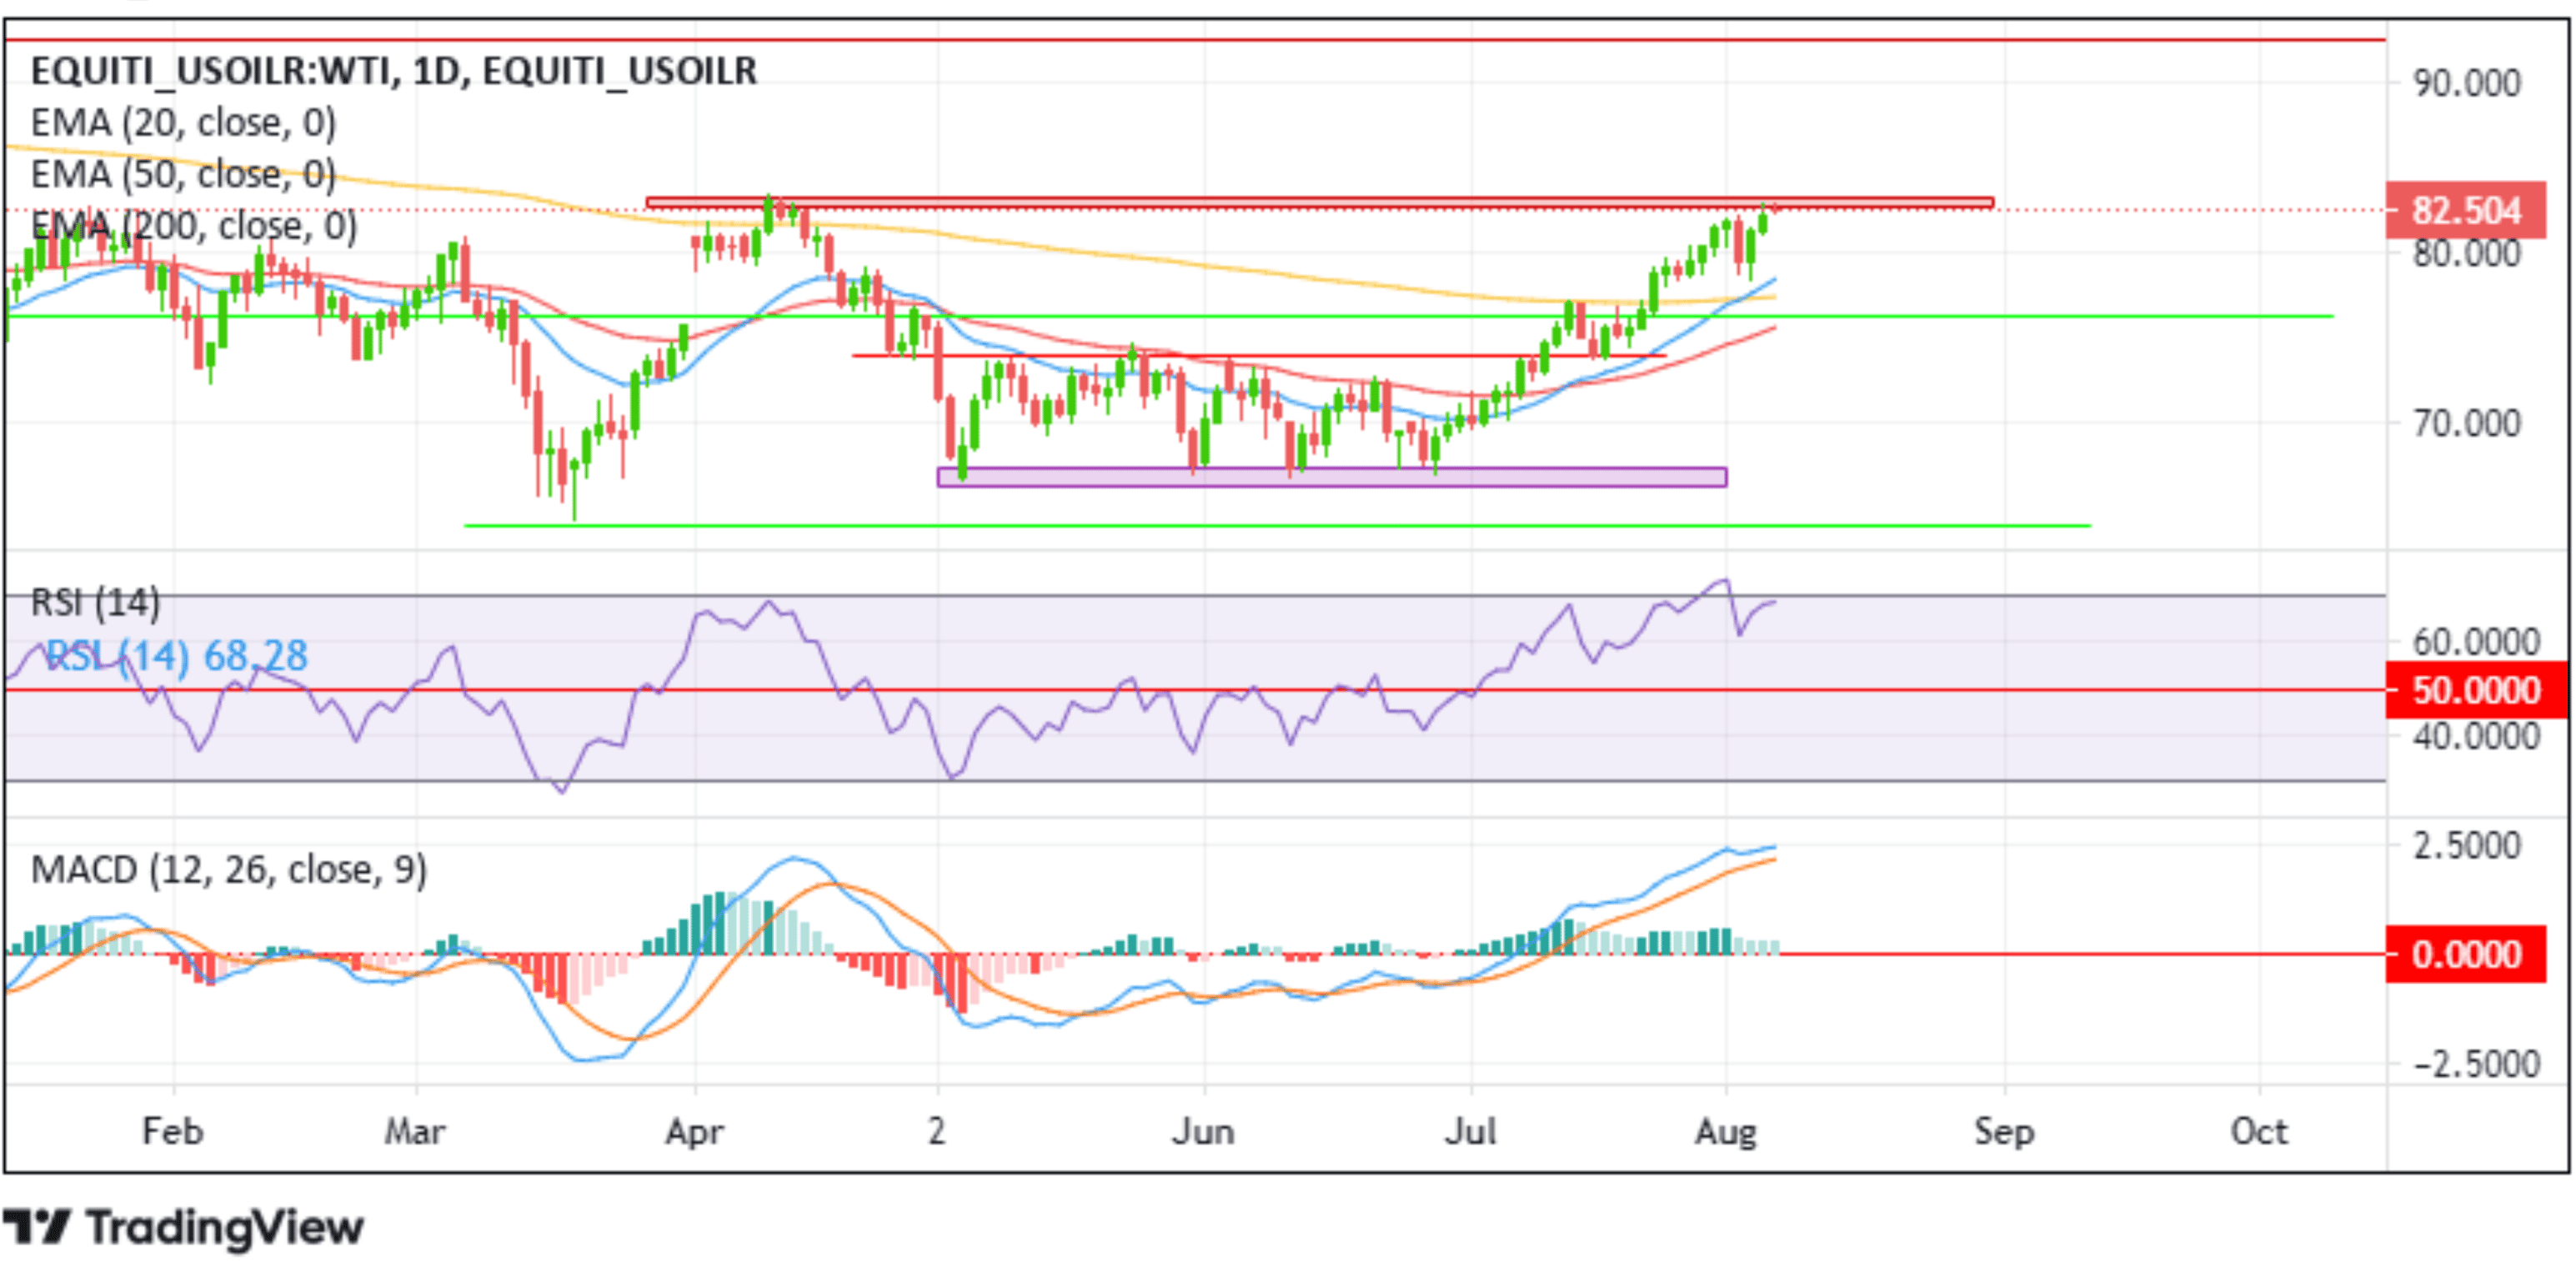 From a technical perspective, strong follow-through selling would cause US WTI crude oil prices to drop towards tagging the 20 (blue) and 200 (yellow) days Exponential Moving Average (EMA) levels at 78.512 and 77.427 levels, respectively. A convincing move below these levels would negate the bullish bias and pave the way for aggressive technical selling around crude oil prices. The bearish trajectory could then be extended below the 76.924 horizontal level toward the 20-day (red ) EMA level at 75.657, below which the price could drop further toward the 73.937 support level. A decisive flip of this support level into a resistance level would pave the way for a further extension of the bearish trajectory toward the demand zone ranging from 67.936 - 66.649 groups. Sustained weakness below this zone would cause US WTI crude oil to be more vulnerable, paving the way for a move toward the 2023 record low at 64.332 level.
On the flip side, if buyers resurface and spark a bullish turnaround, initial resistance comes in at the supply zone, ranging from 83.354 - 82.822 levels. Sustained strength above this zone would reaffirm the bullish bias and pave the way for a rally toward the 92.557 resistance level. If the price pierces this barrier, attention will shift toward the 93.760 confluence level as a result of 50 (red) and 200 (yellow) days EMA crossover, about which, if the price clears this barrier decisively, the bullish trajectory could be extended further towards the 100.00 mark.