AUD/USD Extends Corrective Pullback Above The 0.67100 Mark On Weaker U.S. Dollar, All Eyes On U.S. CPI Data


Key Takeaways:
- The AUD/USD cross gained positive traction on Thursday during the Asian session and moved above the 0.67100 mark
- A combination of factors weighs on the buck and helps cap the downside for the AUD/USD pair
- Upbeat Ausi Trade Balance data underpins the antipodean and helps exert upward pressure on the AUD/USD pair
- The market's focus shifts toward the release of the U.S. consumer price inflation figures for fresh AUD/USD directional impetus
The AUD/USD pair gained positive traction on Thursday. They extended the corrective pullback from the vicinity of the 0.66862 level touched on Wednesday and rose just above the 0.67100 mark during the mid-Asian session, marking a 0.26% daily gain. The pair looks set to maintain its offered tone heading into the European session amid the prevalent tone around the greenback.
Diminishing doubts over early interest rate cuts by the Federal Reserve, along with signs of stability in the financial markets, dragged the safe-haven U.S. dollar away from a one-week high/102.662 level touched on Tuesday and was seen as a key factor that underpinned the AUD/USD pair.
Further weighing on the buck and contributing to the sentiment around the AUD/USD pair is the decision by investors to stay on the side-lines ahead of the release of the U.S. inflation data report on Thursday. According to a consensus report, headline inflation in the U.S. is expected to have jumped modestly to 0.2% in December from 0.1% in November. Excluding food and energy, inflation in the U.S. is expected to have dropped to 0.2% from 0.3% in November.

Additionally, the buck continues to be weighed down by a New York Fed report on Monday, which showed that U.S. consumers' projection of inflation over the short run fell to the lowest level in nearly three years in December. A drop in inflation closer to the Fed's 2% annual target would make it more likely that the U.S. central bank will cut rates in the coming months.
Moreover, an upbeat Australian Bureau of Statistics (ABS) report released earlier today supports the antipodean and helps exert upward pressure on the AUD/USD cross. Australia's trade surplus on goods increased to AUD 11.44 billion in November 2023 from an upwardly revised AUD 7.66 billion in the previous month, surpassing market forecasts of AUD 7.5 billion. It was the largest trade surplus since March 2023, as exports rose while imports slumped.
As we advance, investors look forward to the U.S. docket featuring the release of the Initial Jobless Claims data report for the past week. However, the focus remains on releasing the key inflation data report later during the early North American session. Any surprises to the incoming data will undermine the buck and help extend the corrective pullback further, paving the way for more gains around the AUD/USD pair.
Technical Outlook: Four-Hours AUD/USD Price Chart
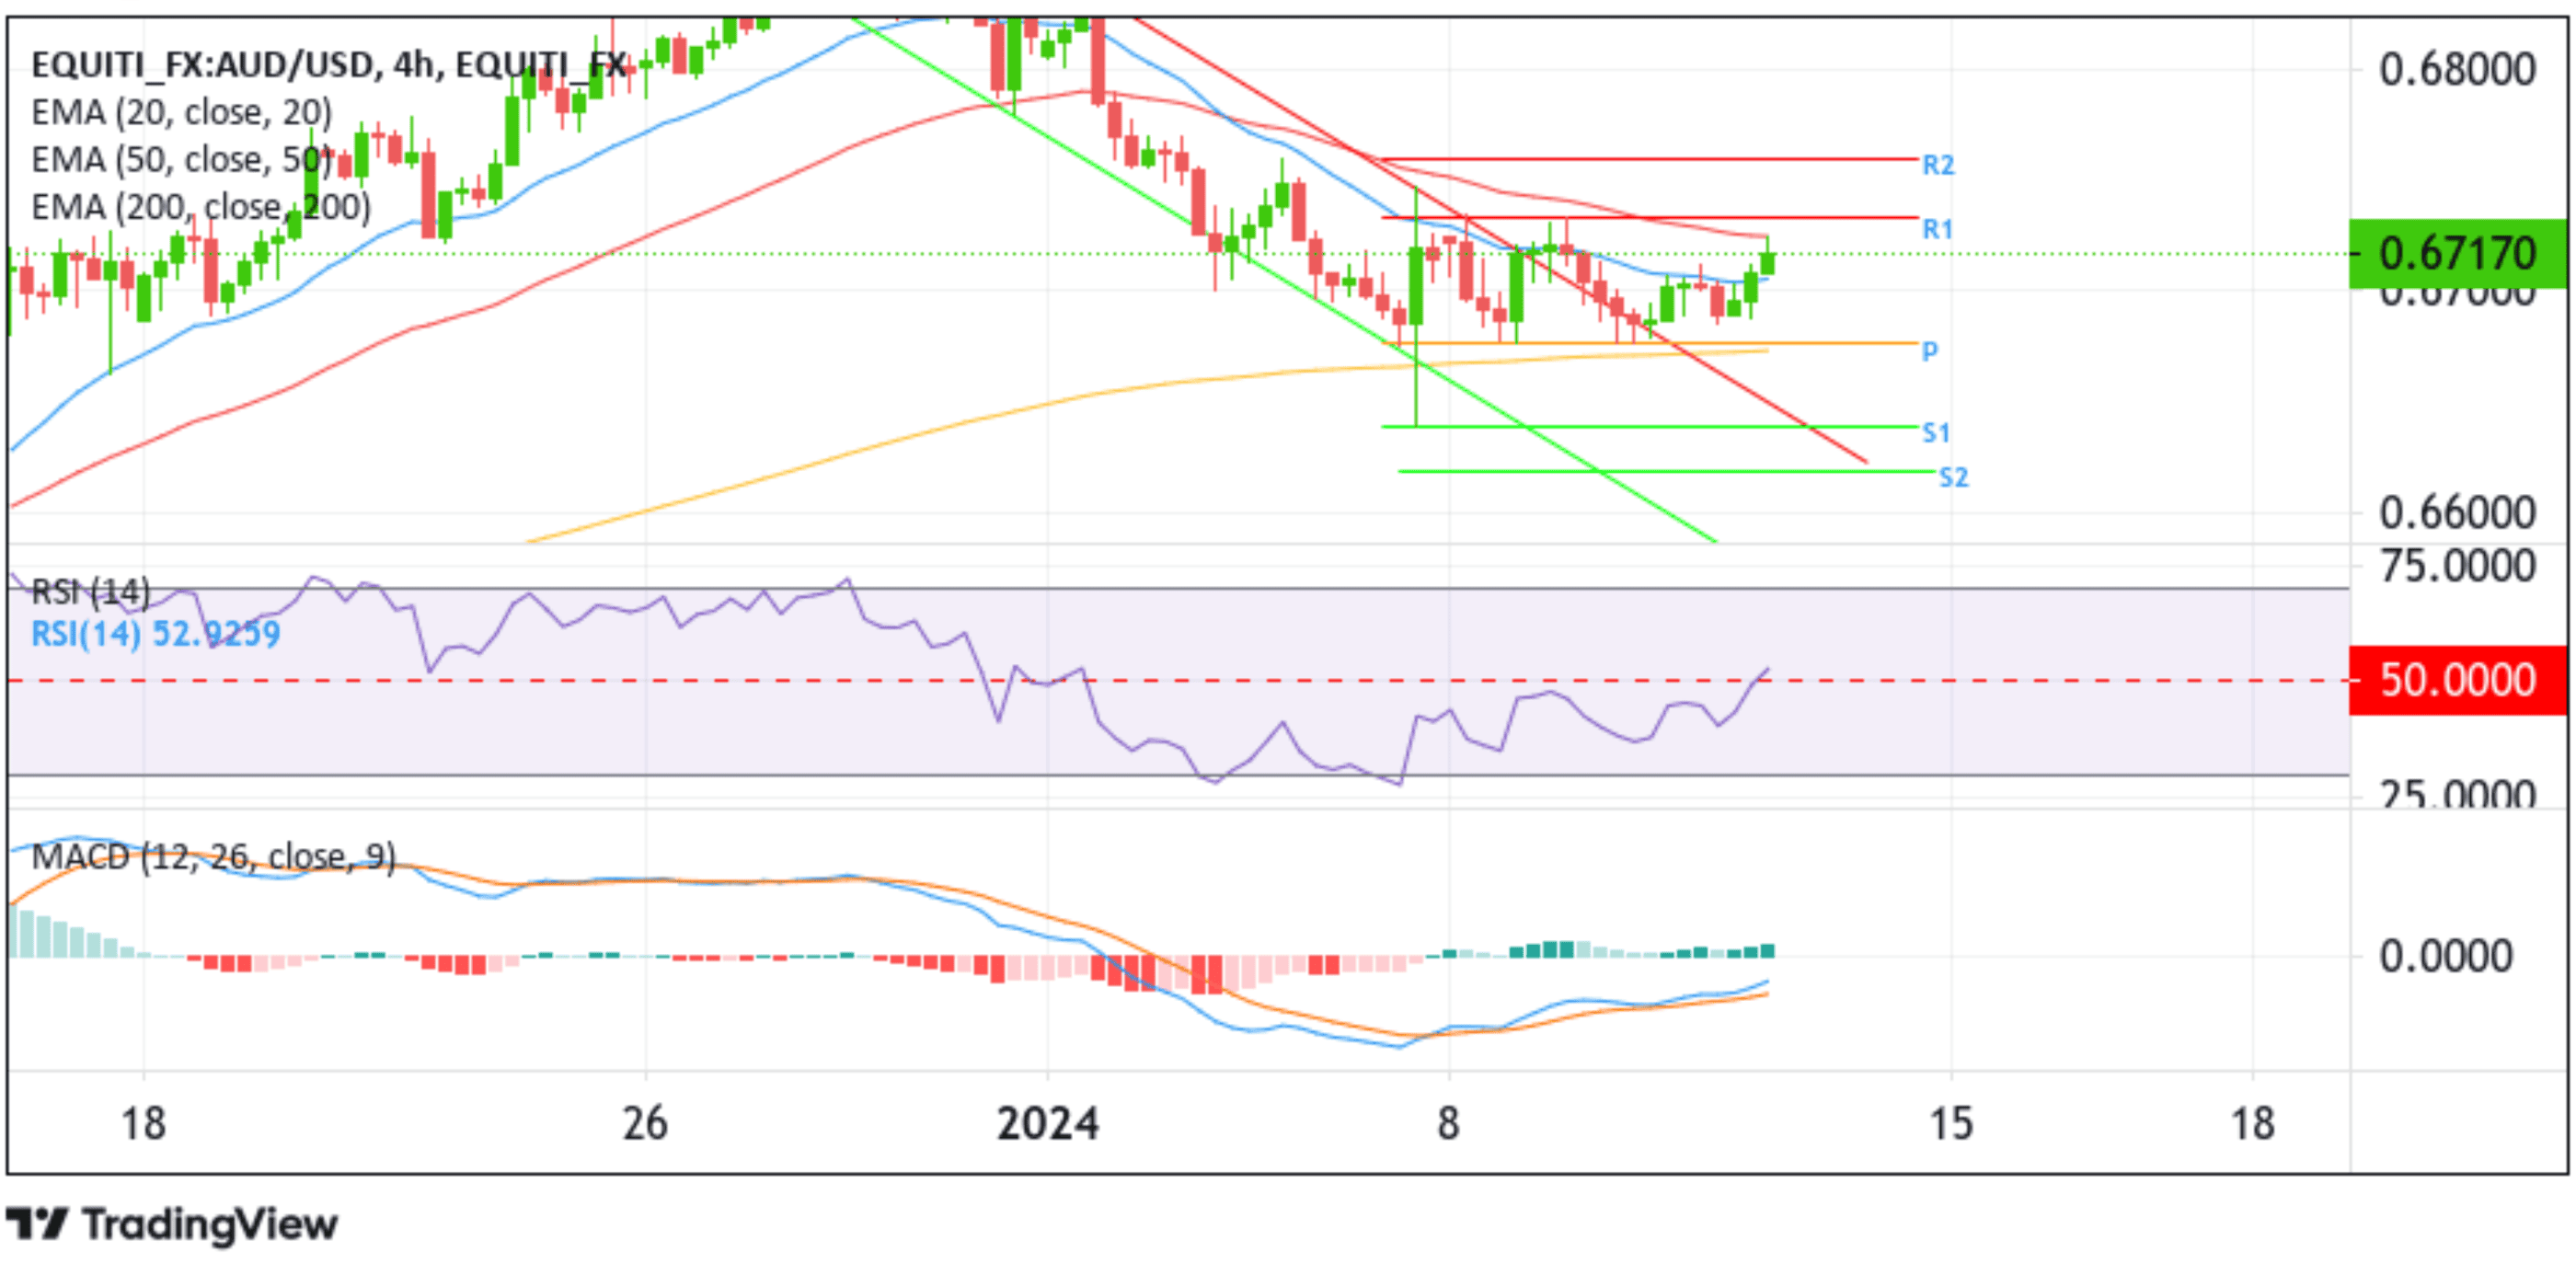
From a technical standpoint, the price's ability to break above the upper limit of the descending channel pattern plus the subsequent bounce from the key pivot level (p) at 0.66762, which sits directly above the technically strong 200-day (yellow) Exponential Moving Average (EMA) at 0.66734 upon a minor pullback, favors buyers and supports prospects for further gains. A further increase in buying momentum would uplift spot prices to tag the 50-day (red) EMA level at the 0.67250 level. Acceptance above this level would pave the way for an ascent toward the 0.67334 resistance level (R1). A clean move above this level would see AUD/USD accelerate its ascend toward the 0.67591 ceilings.
On the flip side, the key pivot level (p) at 0.66762 now acts as an immediate hurdle ahead of the 200-day (yellow) EMA level at 0.66734. Sustained weakness below these barriers will negate the positive bias and pave the way for aggressive technical selling around the shared currency. The AUD/USD price could then accelerate the fall towards the upper limit of the descending channel pattern, now turned support level. A subsequent break below this level would pave the way for a further decline toward the 0.66393 level (S1), followed by the 0.66184 level (S2) and, in extreme bearish cases, AUD/USD could extend a leg down toward the lower limit of the descending channel pattern (key support level).