What To Know About Price Action Trading In Forex - Part 1


Did you know that price action trading is one of the most commonly used trading methods in today's financial market? Whether you are a beginner or an experienced trader, analyzing the price of an asset is perhaps one of the simplest, yet also the most powerful, ways to gain an edge in the market.
After all, Various fundamental and technical analysis tools derive their values from price, so why not study, analyze and learn from the price itself and use it in your trading? In this article, we cover all you need to know about price action trading, explaining what it is, why you should consider using it with Forex.

What is Price Action Trading?
In simple terms, price action is a trading technique that allows a trader to read the market and make subjective trading decisions based on recent and actual price movements rather than relying solely on technical indicators.

Price action describes the characteristics of an asset's price movements. This movement is quite often analyzed to price changes in the recent past. The price of a financial asset, such as a share, currency pair, or commodity, is essential to trading, as, ultimately, the shift in price produces profit or loss. Analyzing an asset's price movement is the core of price action trading. In fact, in answering the question 'what is price action?', it could be said that it is the study of the actions of all the buyers and sellers actively involved in any given market. Therefore, analyzing what the rest of the market participants are doing can give traders a unique edge in their trading decisions.
As a beginner, the two most essential elements to consider when trading price actions are the price and the time variables displayed clearly on a 'clean' chart. It is referred to as a clean or naked chart because there are no indicators to cloud the view of the price action trader.

Understanding Price Action trading
Since price action trading relates to recent historical data and past price movements, all technical analysis tools like charts, trend lines, price bands, high and low swings, technical levels (of support, resistance, and consolidation), etc. are taken into account as per the trader's choice and strategy fit.
Traditionally, price action traders rely on a "naked" chart as they reject the inclusion of indicators with the conviction that, since all supplemental indicators are necessarily lagging interpretations of the basic data available on the price chart, the action of price is itself the most reliable and accurate indicator. They believe everything they need to know about any particular market is displayed in the price. Furthermore, Price action traders do not track actual events because they think the prevailing prices will capture the information. For them, price movement is the ultimate signal provider. This is exactly what now differentiates price action from other forms of technical analysis where the use of mathematical indicators is prevalent.

The price displayed on a price chart at any given time represents market participants' collective beliefs, knowledge, and action. Something worth noting is that the patterns of price movements reveal in real time the balance between the supply for sale and the buying demand of any given security or currency pair. Any price change implies a shift in the relationship between buyers and sellers; an increase in supply will push prices down, whereas an increase in buying demand will send prices higher.
Going forward, price action traders base their trades on predictions of whether buying demand is greater than the supply of sellers, and therefore the price is poised to head higher (or vice versa). In the Forex market, a trader will endeavour to buy (or "go long on") a currency pair when the base currency, the one quoted first, is likely to appreciate against the counter currency. Conversely, they will sell (or "go short on") a currency pair wherein they expect the counter currency to appreciate relative to the base currency. To make these predictions, price action traders interpret the confluence of many factors, particularly trends, candlestick patterns, and price levels known as "support and resistance."

How to read Price Action
Trading on price action involves analyzing trending and pullback waves, also known as impulse and corrective waves. A trend progresses when the trending waves are more significant than corrective waves.
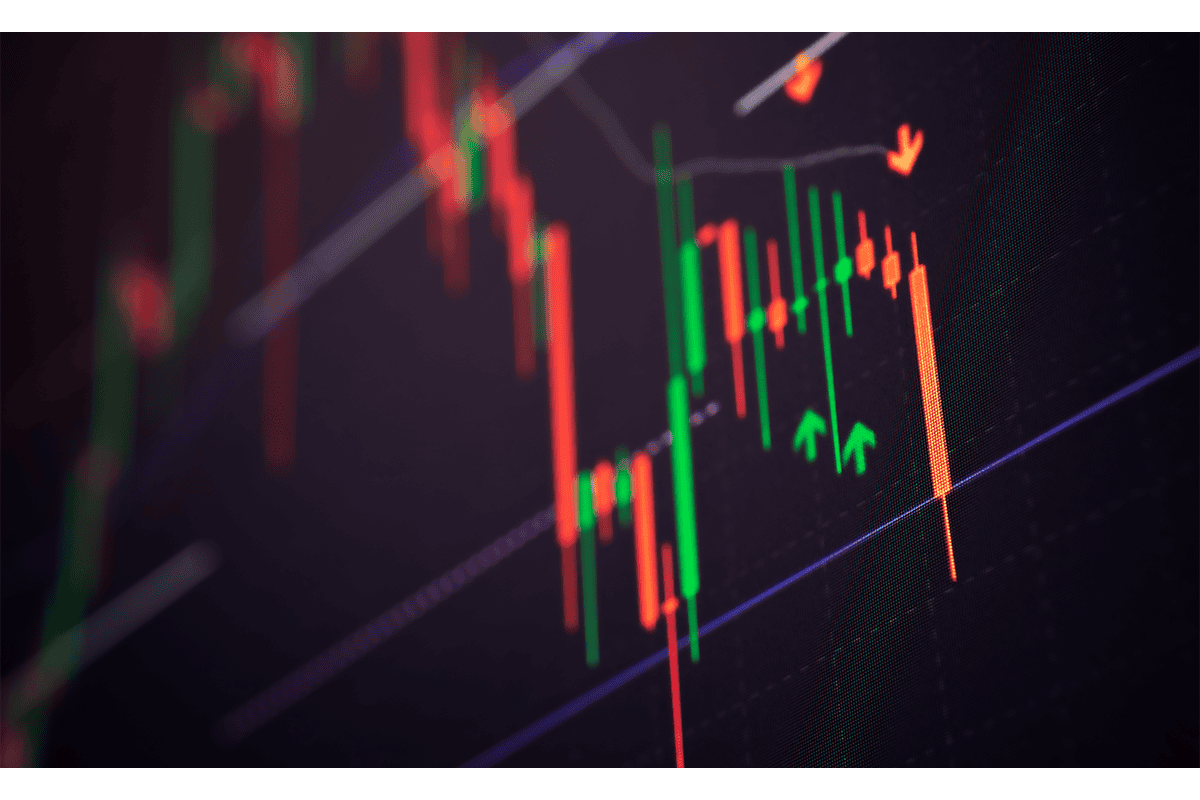
Traders monitor "swing highs" and "swing lows", or the length of the trending and pullback waves, to identify the direction of the trend. During an uptrend, the rules are that the price makes higher swing highs (higher highs) in price and higher swing lows (higher lows). The reverse is true during a downtrend (lower lows and lower highs). The troughs and peaks of trendlines float between lines of support and resistance on a price chart.

After understanding the introduction of Price Action Trading, it is time to implement this tactic into your trading strategies. So how should you get started? Stay tuned for our Price Action Strategy Part 2!


