USD/JPY Extends Intraday Pullback From YTD Peak, Slides Below 133.600 Mark, US GDP & Core PCE Data Awaited


- USD/JPY witnessed selling on Wednesday and extended the intraday pullback
- The risk-off mood and a fresh round of positive U.S. macro data strengthen the greenback, and help exerts further downward pressure on the USD/JPY pair
- Dovish BOJ Governor's comments, plus the monetary policy divergence between the U.S. Federal Reserve and the Bank of Japan, continue to weigh on the Japanese Yen
- A slew of U.S. macro data is set to be released today, but the focus remains on the release of US GDP data and the Fed's preferred inflation gauge, Core PCE, for fresh directional impetus

The USD/JPY pair extended its recent sharp pullback from the 134.504 - 134.737 region or the weekly high and witnessed selling for the second successive day on Wednesday. This also marked the fourth day of a negative move in the previous six and dragged spot prices to over a two-week low, just below the 133.600 mark during the mid-Asian session. A stronger U.S. dollar has acted as a headwind to the USD/JPY pair and helped keep the shared currency under bearish pressure amid the risk-averse. Apart from this, the risk-off mood continued to underpin the greenback and assisted the USD/JPY cross in attracting other selling at lower levels.

Further supporting the greenback was the fresh round of positive U.S. macro data on Tuesday which helped the U.S. Dollar attract some intraday buying to extend the bullish uptick further above the 101.800 mark. A US Census Bureau report on Tuesday showed the number of new building permits issued by the government in the U.S. was revised higher to a seasonally adjusted annualized rate of 1.43 million in March of 2023, compared to initial estimates of 1.413 million and marked a -7.7% rise in March.
Additionally, Sales of new single-family houses in the U.S. unexpectedly jumped 9.3% month-over-month to a seasonally adjusted annualized rate of 683K in March of 2023, the highest in a year, beating forecasts of 630K, according to a report by the U.S. Department of Commerce. That said, the New building permits and New Home sales figures ultimately overshadowed a lower U.S. consumer confidence.
That said, the solid U.S. dollar gains may be limited shortly as treasury bond yields remain downward. Coming data could show slower U.S. growth and lower inflation, cementing the case for a mid-year rate pause. Additionally, signs of stability in the equity markets are also set to be a factor that will act as a headwind for the greenback and offer support to the Yen, in turn, help exert upward pressure on the USD/JPY pair. However, any meaningful upside move for the USD/JPY seems to be elusive amidst the contrast in monetary policy adoption between the Federal Reserve (Fed) and the Bank of Japan (BOJ). The Bank of Japan has always stuck to its ultra-loose monetary policy, while other major central banks worldwide chose to hike interest rates to tame inflation. BOJ officials have also maintained their ultra-dovish stance regarding monetary policy statements.

The new Bank of Japan Governor, Kazuo Ueda, said the bank would likely maintain its ultra-dovish stance soon. Ueda's comments come ahead of a BOJ meeting on Friday, with markets seeing little potential for a change in the central bank's yield curve control policy. Furthermore, Ueda's comments were a key factor that undermined the Yen and helped exert downward pressure on the USD/JPY Pair. In contrast, the Fed has always been willing to hike interest rates to tame inflation in the U.S., which remains above its 2% target. Additionally, several key Fed officials have advocated for further interest rate increases to battle inflation. However, coming data on Thursday and Friday might suggest the Fed might soon be pivoting, and the potential pause in rate hikes might come as soon as June.
Nevertheless, the Federal Reserve is expected to hike interest rates by basis points next week. Markets are seen convinced that the FED will hike interest rates next week by 25bps to 5.00% as CME's Fed Watch Tool shows Fed fund futures traders are now pricing in an 86.3% chance that the Fed will hike rates by 25 basis points in May, up from 84.1% last week.
As we advance, investors look forward to the U.S. docket featuring the release of the U.S. Core Durable Goods Order (MoM) Report data for March, seen lower at -0.2%, down from -0.1%. Investors will look for cues from the release of the U.S. Goods Trade Balance Preliminary Report data for March, which is seen higher at -89.00B, up from -91.99B. However, the focus remains on US GDP data and the Fed's preferred inflation gauge, Core PCE, all set for release on Thursday and Friday, respectively.
Technical Outlook: Four-Hours USD/JPY Pair Price Chart
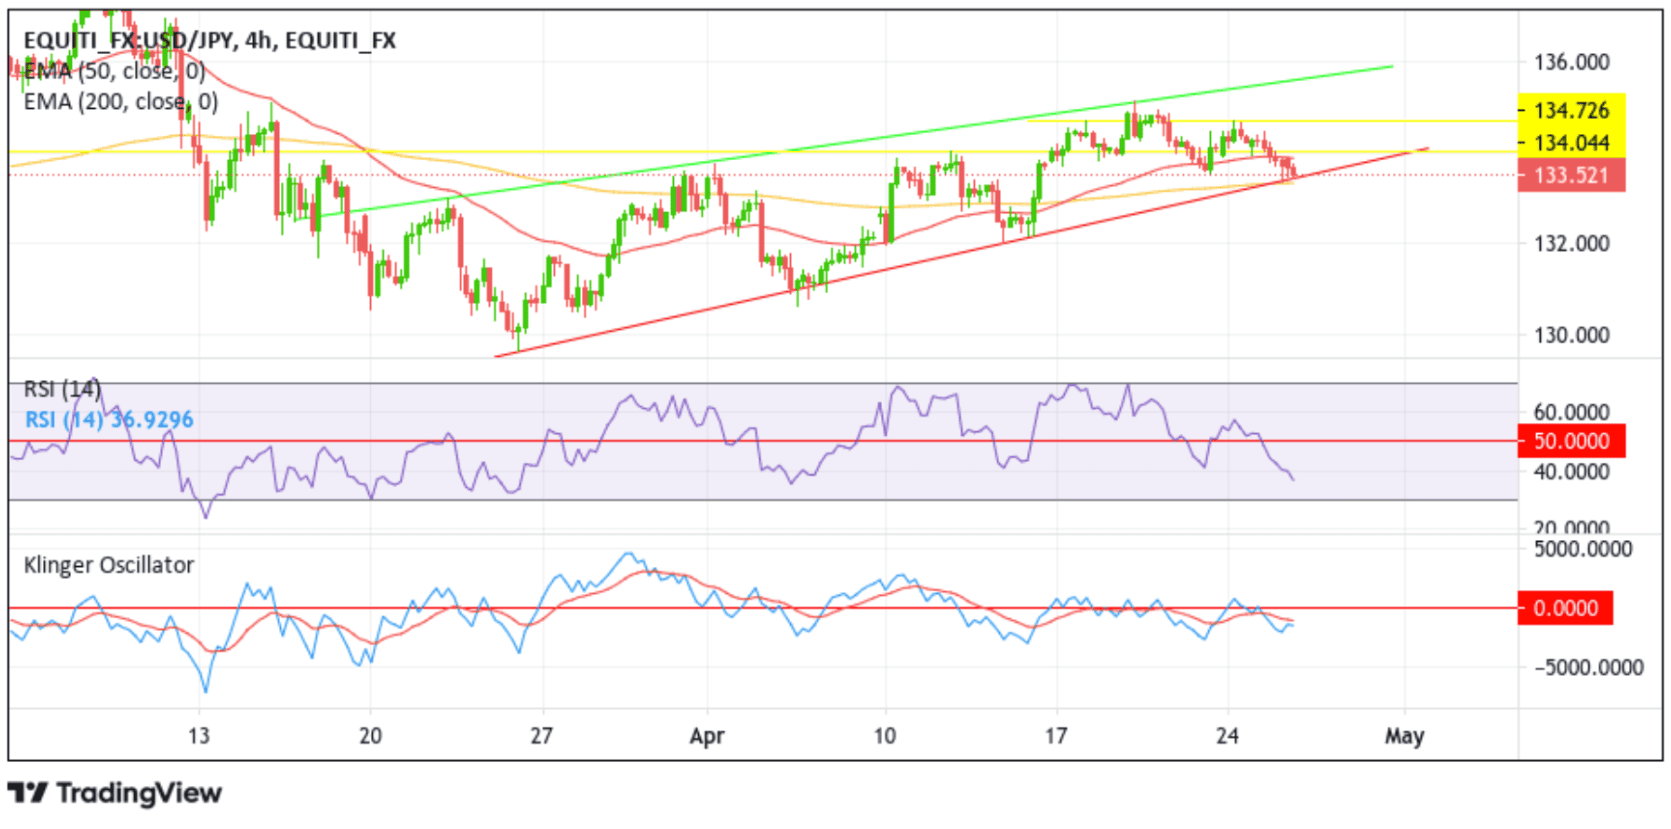
From a technical perspective, the USD/JPY price is at 133.521 level at the time of writing, down over 0.1% for the day. An increase in selling pressure for the shared currency could cause the USD/JPY pair to break below the key support level (bearish price breakout) plotted by an ascending trendline extending from the late-March 2023 swing low. Selling pressure could then be opened toward confronting the technically strong 200-day EMA (yellow) level at 133.347. A four-hour candlestick close below this level would negate any-near bullish outlook and act as a new trigger for sellers to heed the call to continue shorting the USD/JPY pair. Sideways traders might jump in after receiving further support from technical oscillators (RSI 14 and Klinger Oscillator), which are in bearish territory, pointing to a bearish sign of price action. At this moment, the selling pressure would be massive, which could lead to further USD/JPY weakness.
On the flip side, if bulls overpower the bears, the USD/JPY pair could ascend toward the immediate resistance at the 134.044 level. A decisive flip of this resistance level into a support level would pave the way for additional gains for the USD/JPY pair. The bullish uptick could then be extended toward confronting the seller congestion zone due to the 20-day (blue) and 50-day (red) EMA levels at 133.989 and 133.898, respectively. Sustained strength above this zone would rejuvenate the bullish momentum, provoking an extended rally above the 134.044 resistance level. In highly bullish cases, the bullish trajectory could lead the USD/JPY pair to retest the key resistance level plotted by an ascending trendline extending from the mid-March 2023 swing high after breaking above the 134.726 resistance level.