Trading Indicator Basic: Volume Trading


The changes in the price movements of currencies may not always reflect their true nature. Hidden behind the movement of an uptrend or downtrend, new trends may be emerging, or existing ones may be losing momentum and reversing. Therefore, traders often rely on different trading styles that use market momentum to validate a price signal. One such trading style is volume trading, which assumes that changes in trading volume can provide valuable insights into market trends, price movements, and potential trading opportunities.

What is Volume Trading
Volume trading is a strategy that involves taking advantage of significant trading volumes to capitalize on price fluctuations. The strategy involves buying and selling large amounts of a financial asset at different times to take advantage of short-term price changes. Volume traders may also use technical analysis to identify when a financial asset is likely to experience an increase in trading volume. This strategy can generate profits in both rising and falling markets.
Types of Volume Trading
Traders use several types of volume trading to make informed trading decisions.

1. Accumulation and Distribution
Accumulation and distribution help traders identify the buying and selling activities of prominent market participants. Traders look for divergences between price movements and trading volumes. If the price of an asset is rising but the trading volume is decreasing, it may indicate that the asset is being moved by more prominent players. Conversely, if the price is falling but the trading volume is increasing, it may indicate that the asset is being distributed by more significant players.
2. On-Balance Volume
On-balance Volume measures the Volume of trades for an asset over a period and then adds or subtracts the Volume based on whether the asset's price is rising or falling. This creates an on-balance volume line that can be used to identify potential trend reversals.
3. Volume Price Trend
Volume Price Trend (VPT) measures the relationship between Volume and price movements and plots a line that reflects the rate of change of the asset's price to its trading volume. If the VPT line is rising, it indicates that the asset price is rising at an increasing rate and there is strong buying pressure. If the VPT line is falling, the asset's price is increasing, and there is strong selling pressure.
Strategies for Volume Trading
Here are some strategies for volume trading that traders may find helpful:
- Volume analysis: To effectively use Volume in your trading, you need to analyze the Volume of a particular asset in relation to its price movement. A high volume on an uptrend indicates bullish sentiment, while a high importance on a downtrend indicates a bearish sentiment. This information can be used to confirm price trends or to identify potential reversals.
- Relative Volume: It is essential to analyze the Volume of an asset close to its historical average. This can help you identify significant changes in Volume and predict potential changes in price movement. For example, if the Volume of an asset is significantly higher than its historical average, it may indicate a strong trend or a potential reversal.
- Breakout trading: A breakout occurs when an asset moves beyond a key support or resistance level. If there is a significant increase in Volume during a breakout, it may indicate that the trend is solid and likely.
- Scalping: Scalping involves making small profits from small price movements. Traders who use this strategy may look for assets with high Volume and liquidity to take advantage of small price movements.
Volume trading should be used in conjunction with other technical and fundamental analysis tools to make informed trading decisions. This now takes us to the next part, which discusses the three common volume trading indicators traders can combine with volume trading strategies to be successful traders.
Three Common Volume Trading Indicators
There are several volume trading indicators, each with its own unique approach and calculation.
1. On Balance Volume(OBV) Indicator
The OBV indicator measures buying and selling pressure by adding or subtracting the Volume of trades based on whether the price closed higher or lower than the previous day's close.
Traders use OBV to confirm price trends and identify potential trend reversals. If the OBV line is rising along with the price (price making higher highs and higher lows), buying pressure is increasing, and the uptrend is likely to continue.
On the other hand, if the OBV line is declining while the price is also reducing (price making lower highs and lower lows), selling pressure is increasing, and the downtrend is also likely to continue.
Additionally, the uptrend is likely to stall or fail when the price continues to make higher highs and OBV fails to make higher highs. This is called a negative divergence. Alternatively, When the price continues to make lower lows and OBV fails to make lower lows, the downward trend will likely stall or fail. This is called a positive divergence.
2. Chaikin Money Flow
The Chaikin Money Flow (CMF) indicator is based on the premise that the amount of money flowing in and out of a financial asset is a key indicator of its future price movements. CMF measures the amount of buying and selling pressure by combining price and volume data.
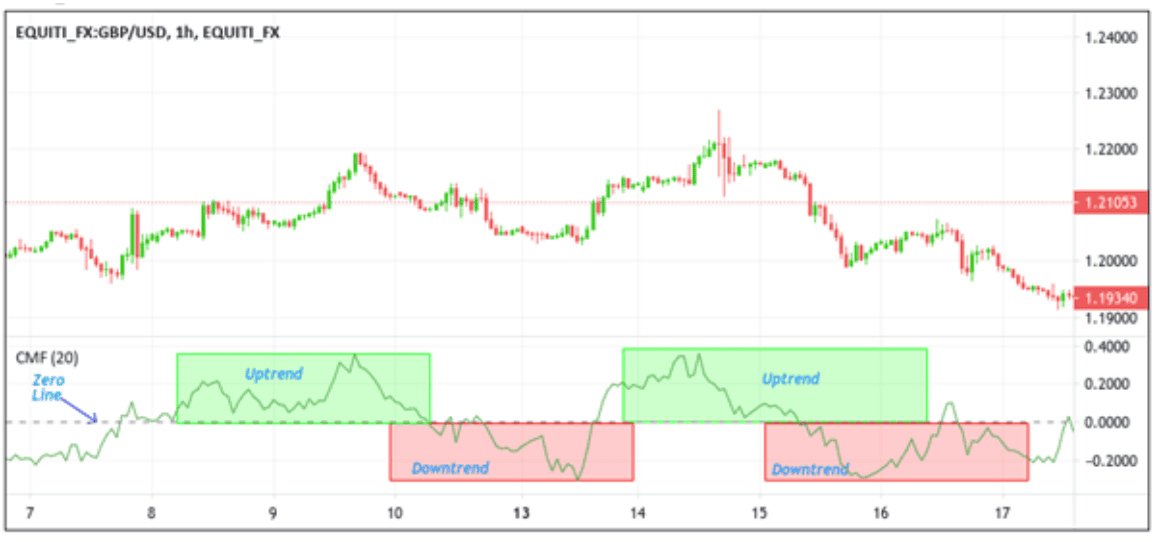
The CMF default set-up is for 20 periods, but you can change that according to your preferences and strategy. The CMF can take values between +1 and –1, but it should be noted that it does not reach the extreme value often. The area above the centre line or zero line is considered to be a bullish territory, while the area below the line is considered to be a bearish territory.
Consequently, when the CMF values are above the zero line, it is an indication of the existence of buying pressure, hence denoting the likelihood of the continuation of an uptrend, while selling pressure probably exists when the indicator values are in the negative area, hence denoting the possibility of the continuation of a downtrend.
3. Klinger Oscillator
The Klinger Oscillator is plotted by two lines: Klinger and Signal. The oscillator calculates the difference between two Exponential Moving Averages (EMAs) of Volume and plots the result as a histogram. The two EMAs used are typically 34-period and 55-period. The difference between the two EMAs is then plotted as a line, which is the Klinger line.
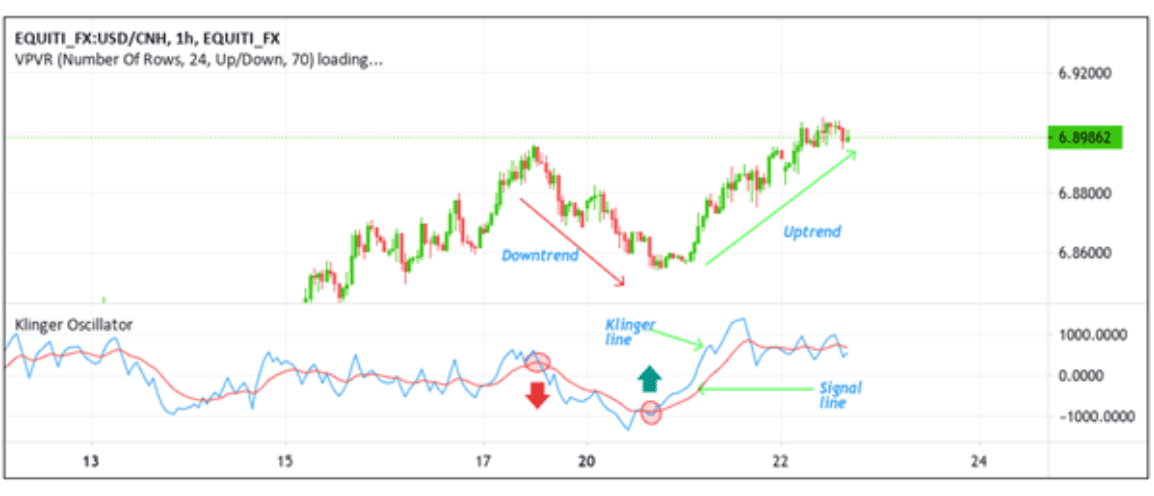
When the Klinger line crosses above the signal line, it indicates a bullish trend, while a cross below the signal line indicates a bearish trend. Traders may use this indicator to help identify buying and selling opportunities based on market momentum.
Having looked at the three most common volatility trading indicators, it's essential for traders to know and understand the principles they need to consider for volume trading.
Principles To Consider For Volume Trading

When considering volume trading, it's essential to keep in mind the following principles:
💡 Volume as a confirmation tool: Volume can be used to confirm the strength or weakness of a trend. If a price trend is accompanied by high trading volume, it indicates that there is strong momentum which could signal a continuation of the trend. Conversely, if a price trend is accompanied by low trading volume, it could indicate a lack of conviction and a potential reversal in the trend.
💡 Look for divergence: Divergence occurs when the price of a security is moving in one direction while the trading volume is moving in the opposite direction. For example, if the price of a stock is rising, but the trading volume is decreasing, it could signal a potential trend reversal.
💡 Volume spikes: Look for unusually high trading volume, indicating significant news or events that could impact the stock price. For example, a sudden increase in trading volume could be caused by an earnings announcement, a merger or acquisition, or a major news event.
💡 Watch for support and resistance levels: High trading volume at support or resistance levels could indicate significant buying or selling pressure. If a stock is trading near a support level with a high trading volume, it could mean that buyers are stepping in to support the price. Conversely, if a currency pair is trading near a resistance level with high trading volume, it could indicate that sellers are dominating, and the price may fall.
💡 Use multiple time frames: Volume analysis can be done in various time frames to get a complete picture of the trend. For example, if a commodity shows high trading volume on a daily chart but low volume on a weekly chart, it could indicate a short-term versus long-term trend.
Volume trading can be a powerful tool for traders looking to gain an edge in the markets. By analyzing the buying and selling activity of financial assets, traders can gain valuable insights into the price movements of a particular financial asset. However, it should be used with other technical and fundamental analysis tools, and traders should always exercise caution and risk management when making trading decisions.

Are you looking to start volume trading? You can Enjoy FREE USD 10,000 Virtual Funds for volume trading by Signing Up on the Pocket Trader website. With Pocket Trader, You can invest in multiple markets, including forex, indices, and commodities, learn from experienced traders and share ideas through Pocket-Trader's social features to build wealth together.