FTSE 100 Index Rises To A Two-Week High, Steadies Above 7600.00 Mark As Markets Await UK GDP Data


- FTSE 100 Futures index extends bullish momentum above $7600.0ss amid easing banking concerns
- US Regional Bank's decision to acquire loans and deposits of the fallen SVB sees Major sectors in the UK rebound in turn underpins the FTSE 100 index
- Petrofac (LON:PFC) and Croda (LON:CRDA) head the list of top gainers and top losers this week
- Markets await now the release of the UK GDP data for fresh directional impetus, expected to show modest growth in the UK

The FTSE UK 100 Index Futures prolonged its recent strong move-up witnessed since Wednesday. It gained positive traction for the third successive day on Friday as risk-on sentiment prevailed on easing concerns of a global banking meltdown. As per press time, the UK's leading index is up 0.16% for the day to trade at the $7625.9 level and on course to finish the week in solid gains/2.71% for the quarter. However, the UK 100 index is set to end the month in modest losses after suffering heavily in the previous weeks as concerns over a global banking meltdown shook global markets.

Coming off the back foot of the banking crisis following the collapse of two regional banks in the US - Silicon Valley Bank and Signature bank, followed by a downturn in Credit Suisse, stocks markets in the UK have been able to rebound and head northward as market participants have been able to shrug off fears of the banking crisis contagion that was as a result of aggressive monetary policy tightening by major central banks around the world. Investors seem confident, as they took solace from First Citizens BancShares' agreement to buy all Silicon Valley Bank's failed lender deposits and loans this week. That said, the events on the other side of the Atlantic saw most sectors in the UK make a modest rebound, which ultimately helped lift the UK 100 index higher.
Apart from this, the constant assurance by top Central banks worldwide that they are keen on not allowing such a menace to happen again and more so that their situation is different from each other has changed the mood around equity markets. Additionally, the decisions by some other banks to step in and acquire the affected bank also boosted investors' confidence in the banking sector. UBS's decision early last week to bail out Credit Suisse began a change in the sentiment among market participants concerning the banking sector.
That said, following the banking crisis, Britain launched a long-awaited consultation on reforming rules after the global financial crisis to make top bankers accountable for their decisions.
TOP Gainers and Losers for the Week
Here are this week's top FTSE 100 index movers, a week in which the index is set to close with solid gains.
Top Gainers
- Petrofac (LON:PFC) Ltd surged 69.9% this week after Dutch electricity grid operator TenneT awarded 11 contracts to build systems connecting wind farms in the North Sea to the shore to a consortium led by Hitachi Energy, of which Petrofac is a part.
- BHP Group (LON:BHPB) Ltd gained 7.89% this week following Optimism around a Chinese recovery that is set to boost the company's commodities export revenue
- REIT (LON:RET): The UK Real Estate company's shares were up 6.8% this week after providing a positive operational update
Top Losers
- Croda (LON:CRDA): The Consumer care firm lost 1.52%/98 points this week, dented by weak earnings since the beginning of February after the company's most significant division that serves the beauty, fragrance, and home care markets missed markets expectations for annual profits.
As we advance, investors now look forward to releasing the UK GDP data for the last quarter, which is expected to show the UK economy improved from the previous quarter and rose to 0.4% on a Year-on-Year basis and 0% on a Quarter-to-Quarter basis.
Technical Outlook: One-Day FTSE 100 Futures Price Chart
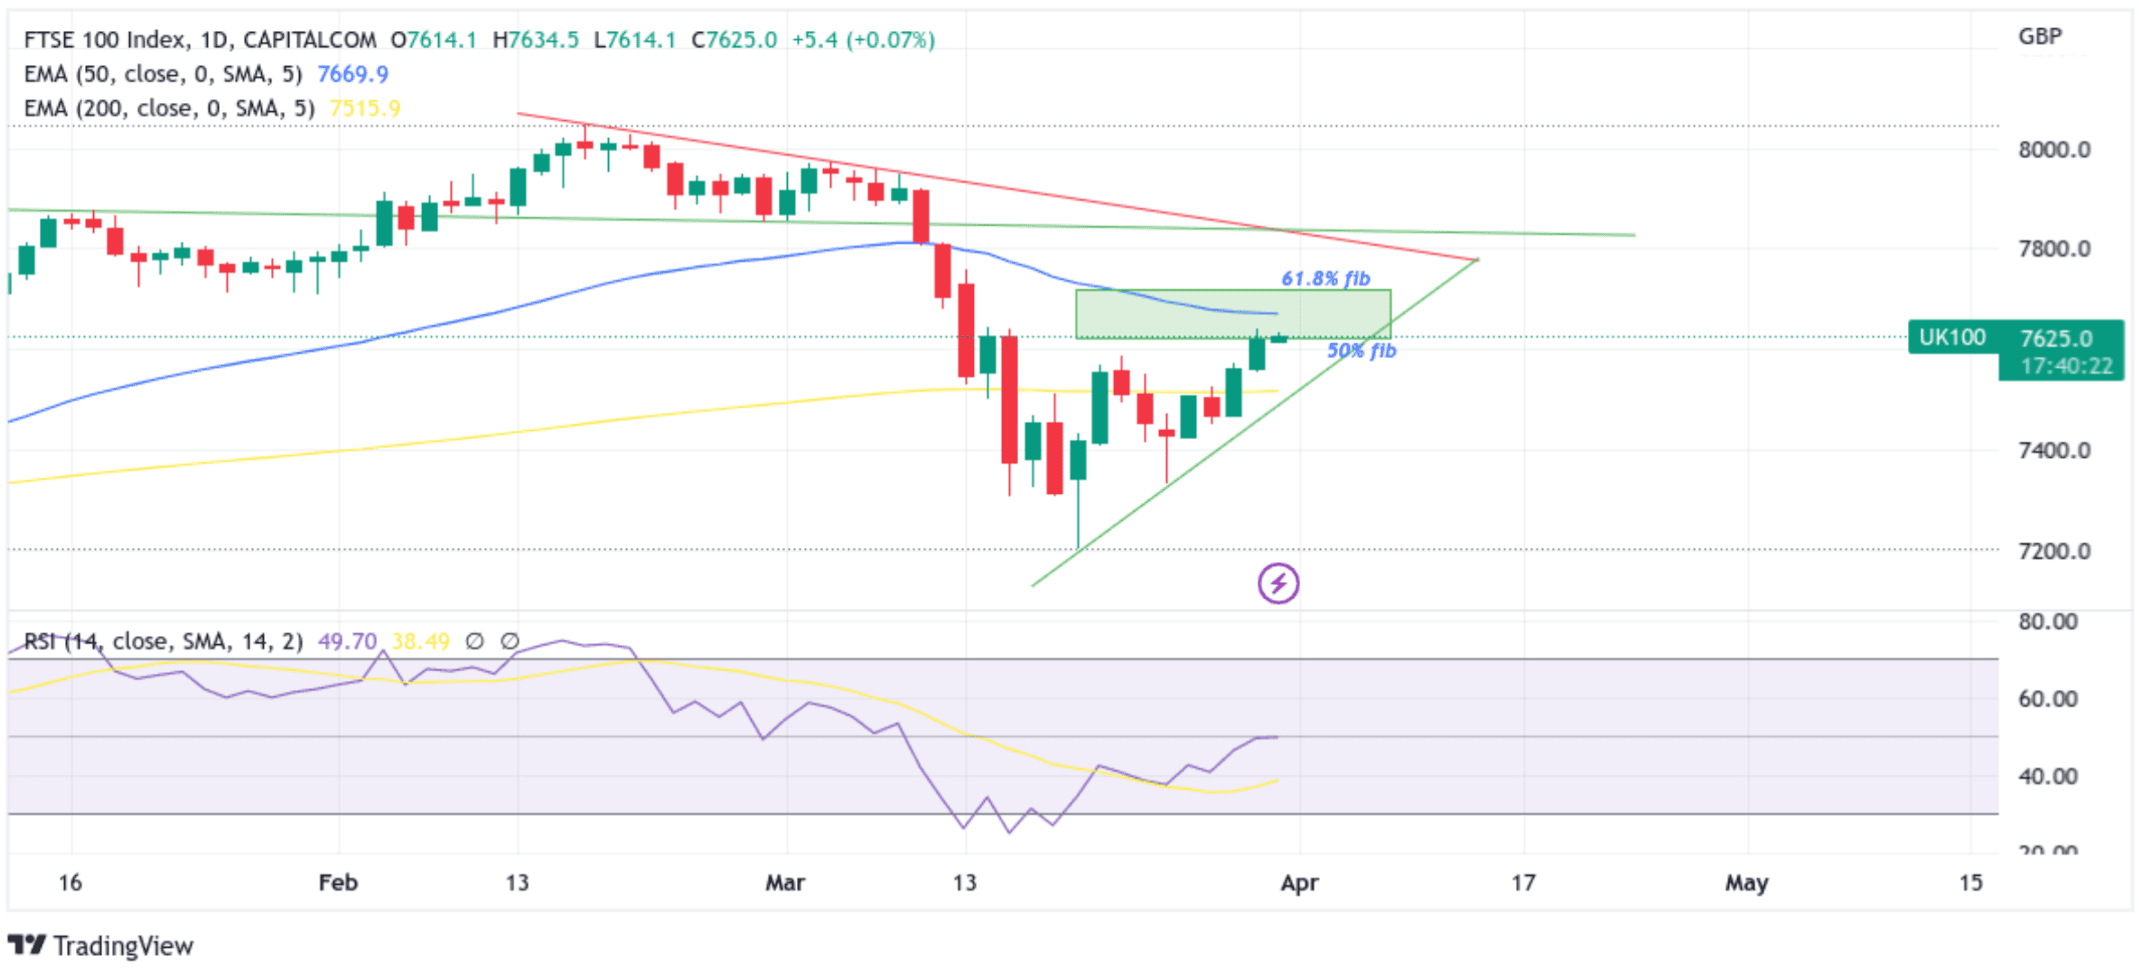
From a technical standstill, the price extended the sharp rebound from the vicinity of the 7331.4 level and staged some follow-through buying above the 7600.0 psychological mark. Price trades within a critical zone plotted by 50% and 61.8% Fibonacci Retracement levels at 7617.5 and 7719.2, respectively. Furthermore, the price still faces the 50EMA overhead resistance within the critical zone at the 7671.0 level. If buyers push above the aforementioned EMA level and flip this obstacle into a support level, dip buyers could join and force a move toward the 61.8% barrier. If the bulls break above this level, it will pave the way for a rally toward the key resistance level plotted by a downward descending trendline extending from the mid-February 2023 swing high. A convincing break above this level (a bullish price breakout) would negate any near-term bearish outlook and pave the way for more gains around the FTSE 100 Futures index. The bullish trajectory could be further extended toward February 2023 swing high.
On the flip side, if dip-sellers and technical traders get enticed by the fact the RSI (14) is still holding in bearish territory and make a comeback by triggering a bearish turnaround, the price will first find support at the 7617.6 support level en route to the 7516.4 support level (200 EMA). If sellers manage to pierce these floors, downside pressure could accelerate, paving the way for a drop toward the key support level plotted by an ascending trendline extending from the late-March 2023 swing low. Sustained weakness below this level would expose the FTSE 100 futures index to more losses.