What To Know About Price Action Trading In Forex - Part 2


You should now have a basic knowledge of Price Action Trading. For revision, please click here to read Part 1.

Price Action Trading Tools
As a beginner, it's essential to know and understand the different types of price action trading tools to develop a successful price action trading strategy. Some of the most Preferred tools for price action traders are breakouts, candlesticks, and trends. They also use theories such as support and resistance. Traders use these tools and ideas to develop strategies that work with their preferences.
1. Breakout
When an asset's price moves with a specific trend or within a range, it alerts traders to a new possible trading opportunity once it breaks that trend or range. For example, suppose EUR/USD is oscillating in a narrow range of between 1.00338 -1.00911 levels, then the price moves above the 1.0091 level. This change in tendency alerts traders that the sideways movement has possibly ended and that a possible move to 1.01465 (or higher) has begun.
It is worth noting, Breakouts occur from many different patterns, including ranges, triangles, head and shoulders, and flag patterns. A breakout doesn't mean the price will continue in the anticipated direction, and it often doesn't. In that case, it is called a "false breakout" and presents a trading opportunity in the opposite direction of the breakout.
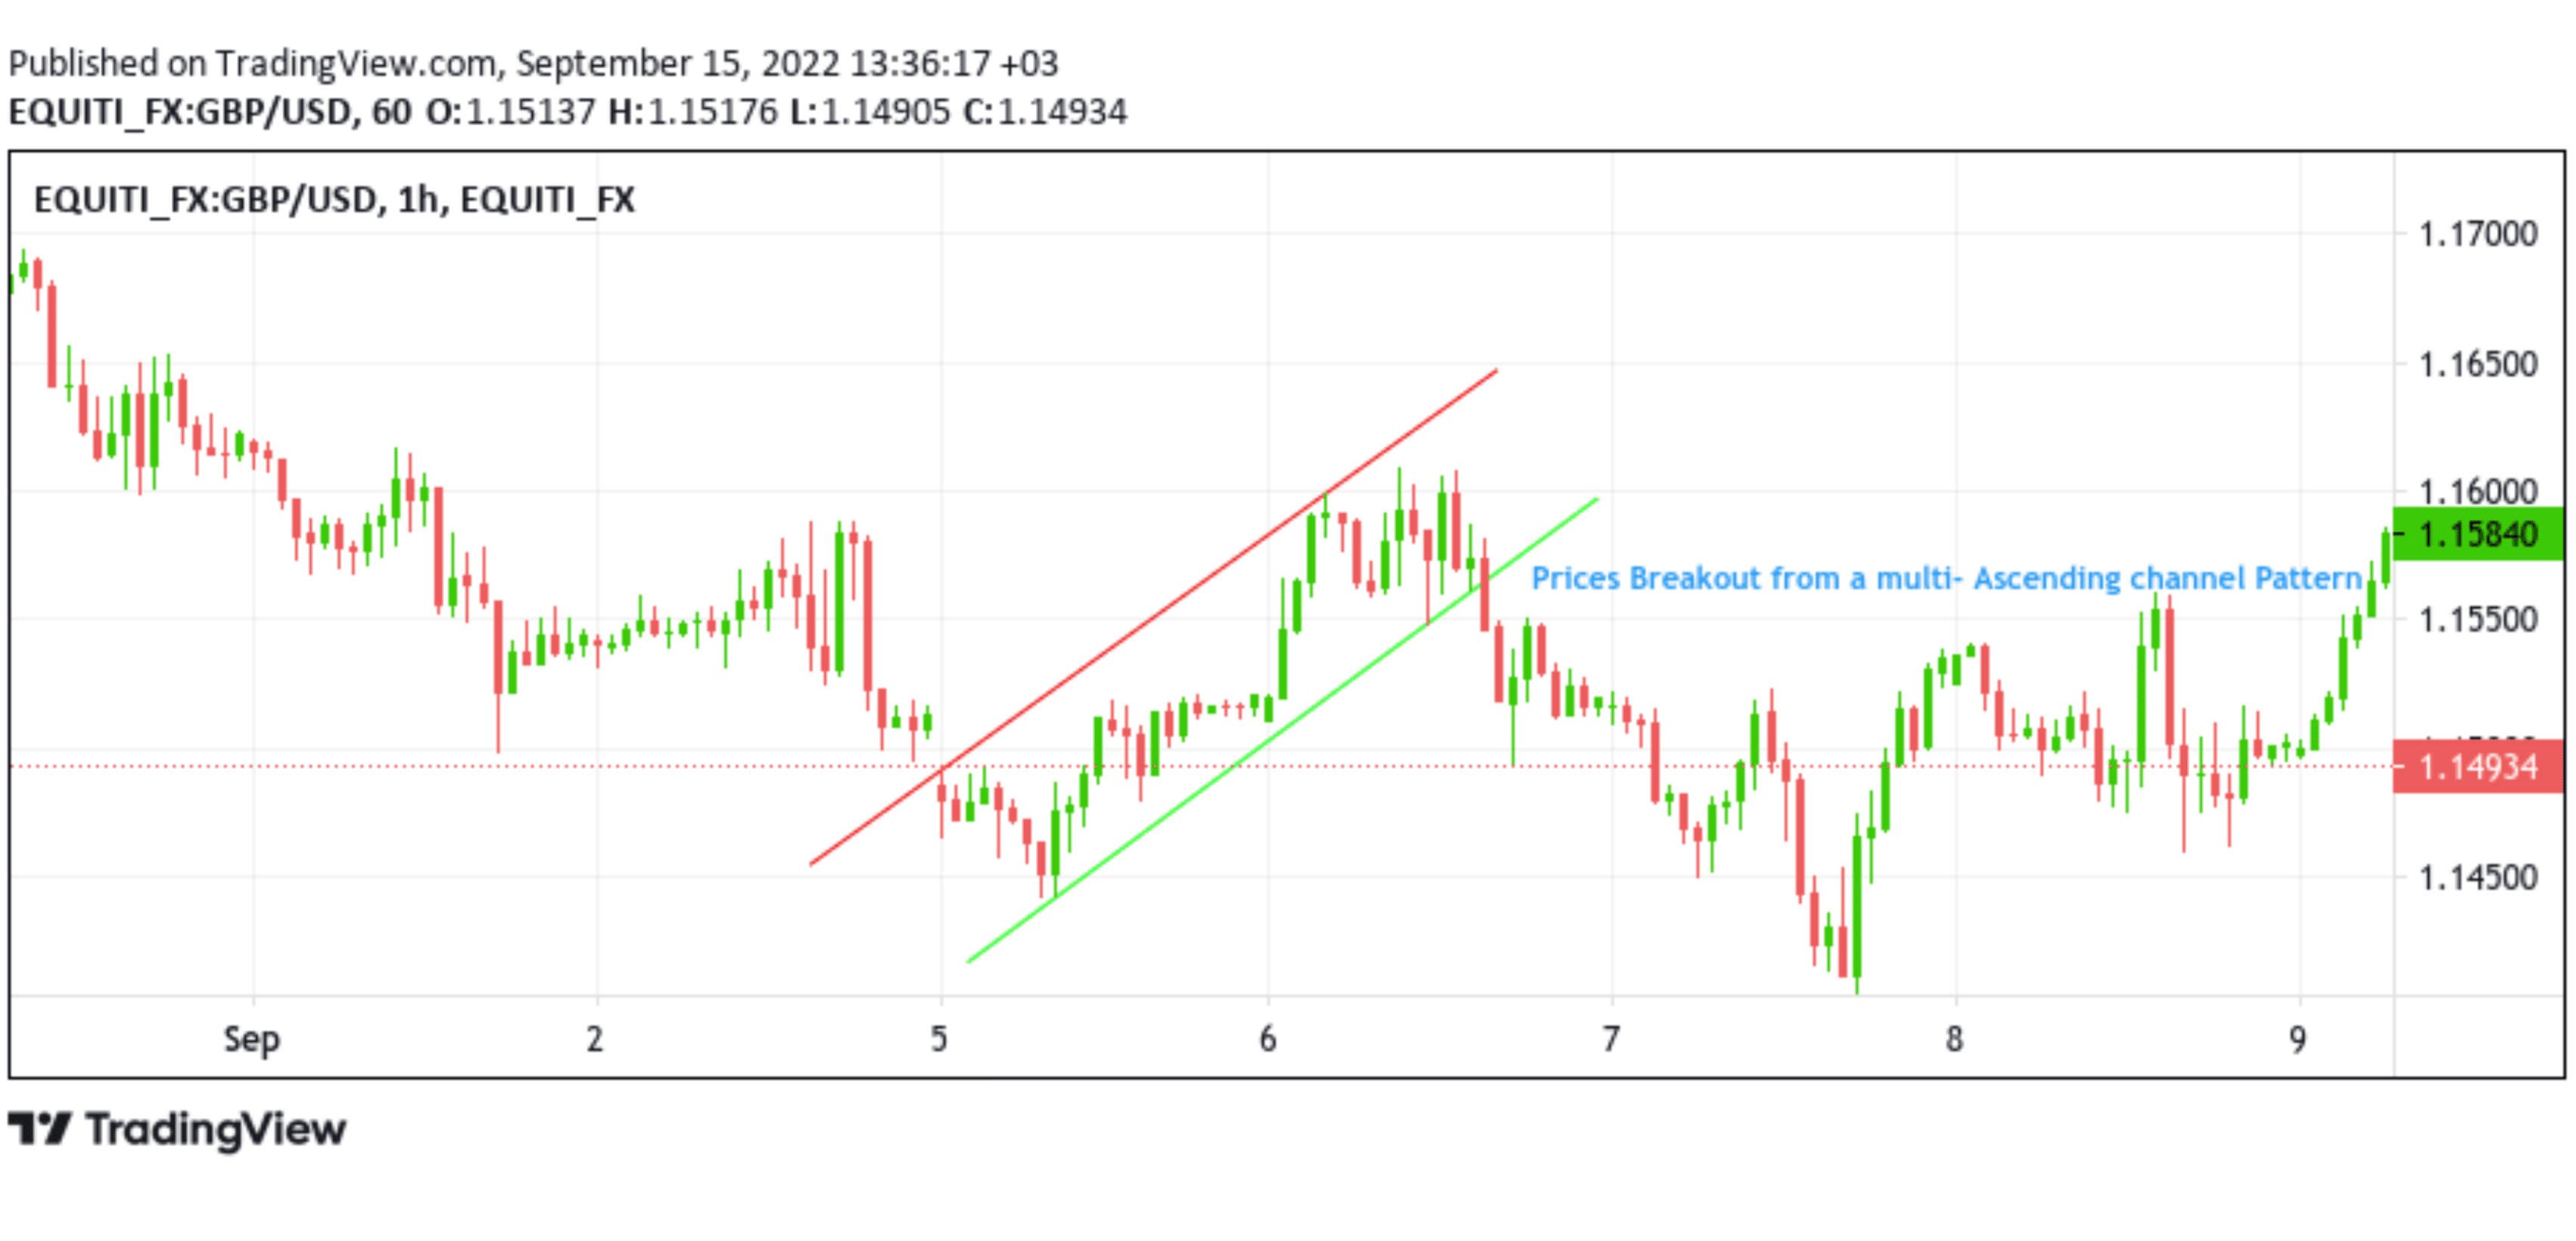
Price Breakout from a multi-ascending channel pattern
2. Candlesticks
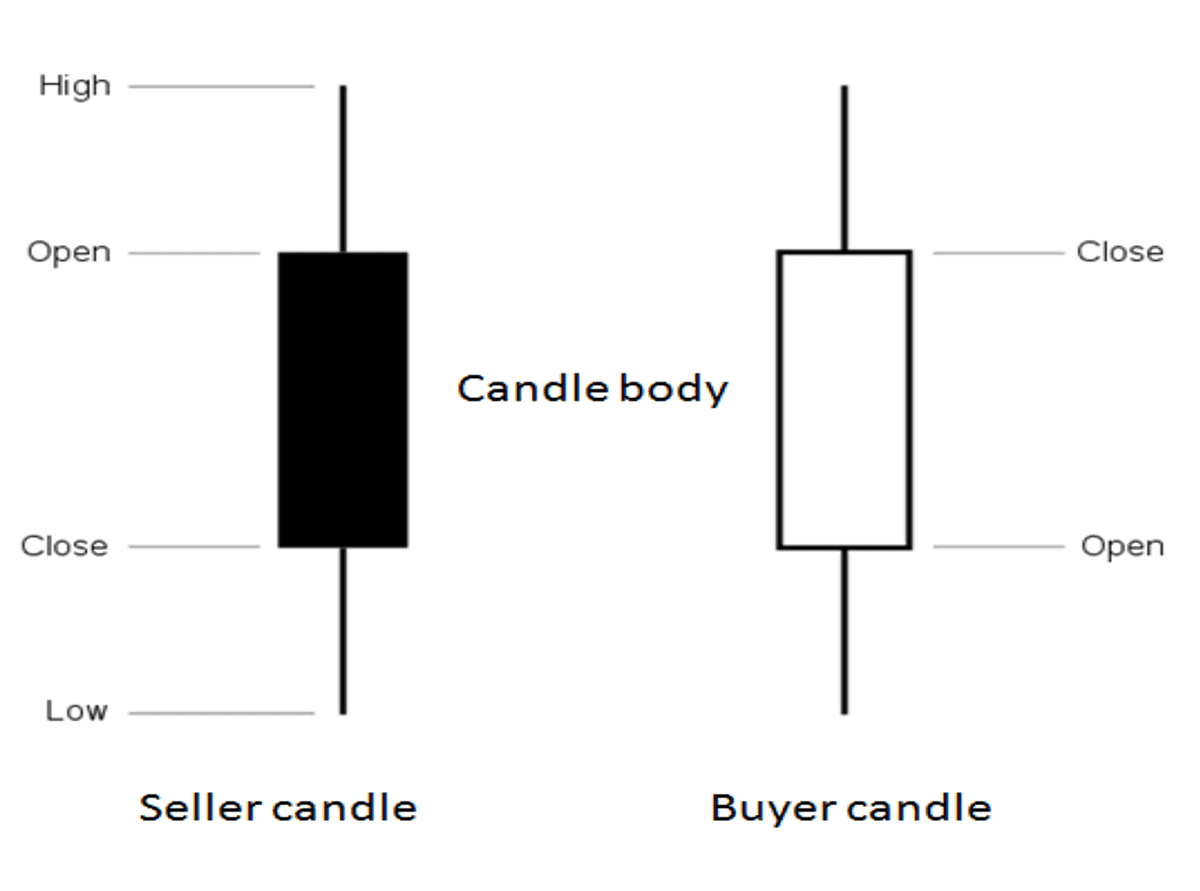
Candlesticks are a chart's graphical representation that shows an asset's trend, open, close, high, and low prices. Traders use candlesticks in various strategies. For example, some traders use the inside bar candlestick strategy when using candlestick charts.
3. Trends
A currency pair/commodity can be trading throughout the day, with prices continuing to climb or fall. Traders refer to these fluctuations as "bullish" trends, where the price is rising(Uptrend), or as "bearish" trends, where the price is dropping(Downtrend)
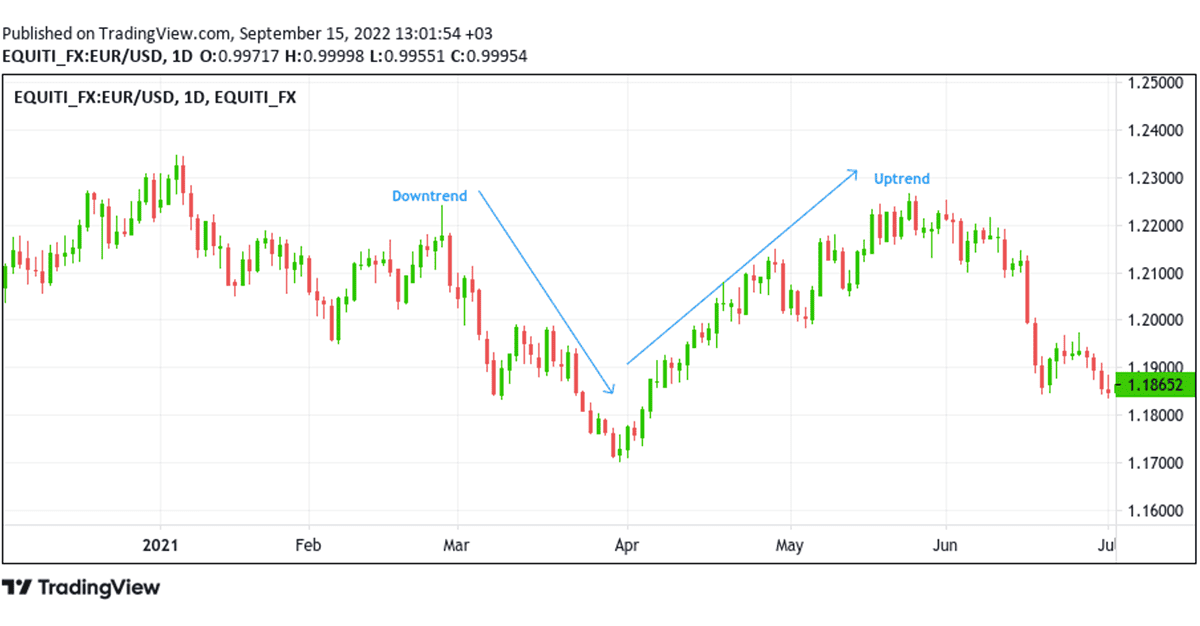
A Downtrend and Uptrend(EUR/USD Daily chart)
4. Support and Resistance
Related to the above, traders use price support and price resistance regions/levels to identify good trading opportunities. Support and resistance areas occur where the price has tended to reverse in the past. Such levels may become relevant again in the future.
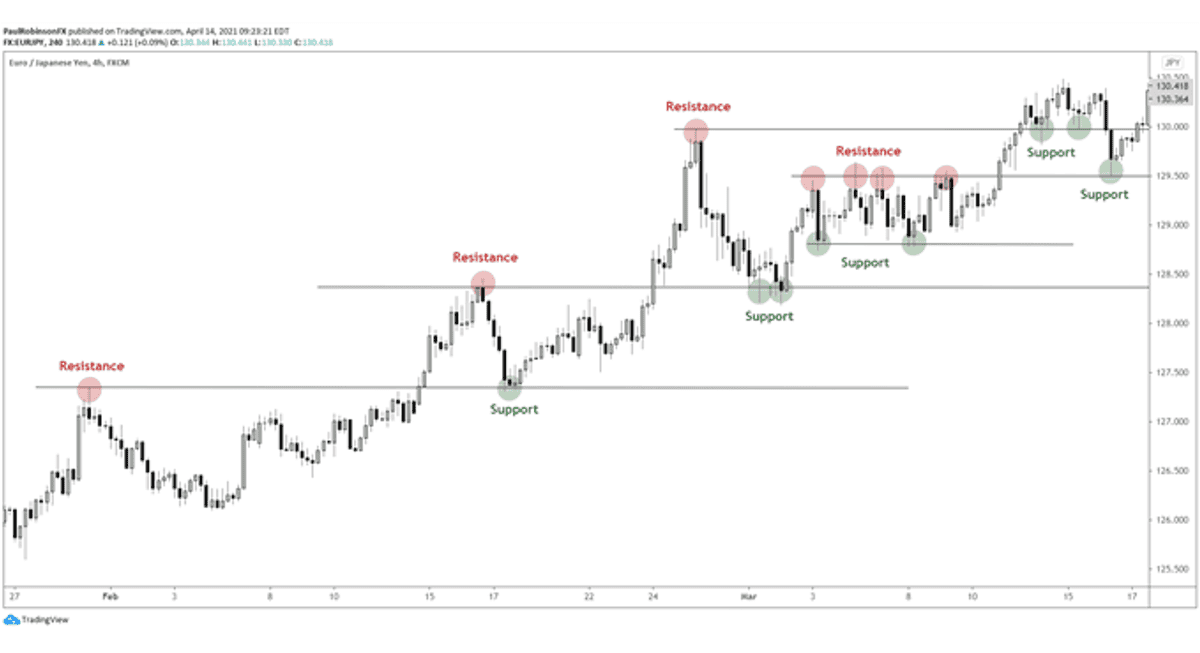
Support and Resistance Levels(EUR/JPY Four-Hour Chart)
Price Action Trading Strategies
Traders who focus solely on the price of an asset to make their trading decision usually use a "price action" strategy that involves analyzing trending waves to ascertain when to enter or exit a position. Below we will look at some of the most common trading strategies and give an example for each.
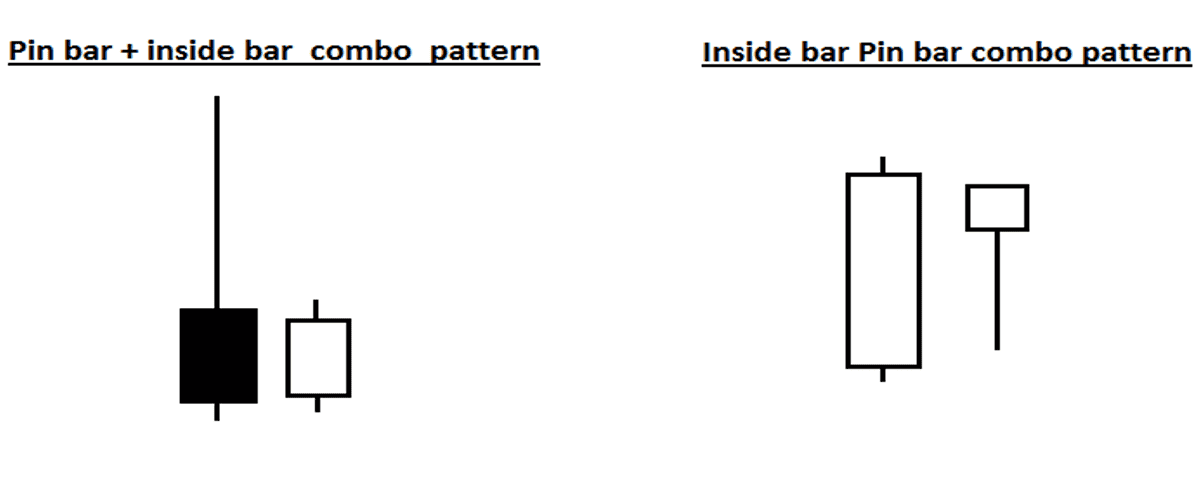
1. Pin Bar and Inside Bar Combo Trading Strategy
A pin bar is a price action strategy that shows rejection of price and indicates a potential reversal is imminent. An inside bar is a price action strategy that shows consolidation and that a potential breakout is imminent. These two signals, when combined, result in either a 'pin bar combo' pattern or an 'inside bar – pin bar combo' pattern.
There are two main 'combo patterns' you should focus on learning.
1) The pin bar + inside bar combo consists of a pin bar that consumes a small inside bar toward the nose of the pin (the pin bar's real body).
2) The inside pin bar combo setup is simply a pin bar that's also an inside bar. In other words, a pin bar that's within the range of an outside bar or mother bar.
Let's take a look at one example to understand pin bar better and inside bar trading strategy:
The chart below shows an excellent example of a pin bar inside bar combo pattern formed following a pullback to a support level in an upward trending market. These combo patterns are compelling because they give you the chance to get a better entry on the pin bar (near its 50% level) and allow you to get a 'tight' stop loss either below the inside bar low or below the key support level. When you see a pin bar followed by an inside bar or even multiple inside bars like the example below, it's time to take notice because you might have a potential trade entry on your hands…
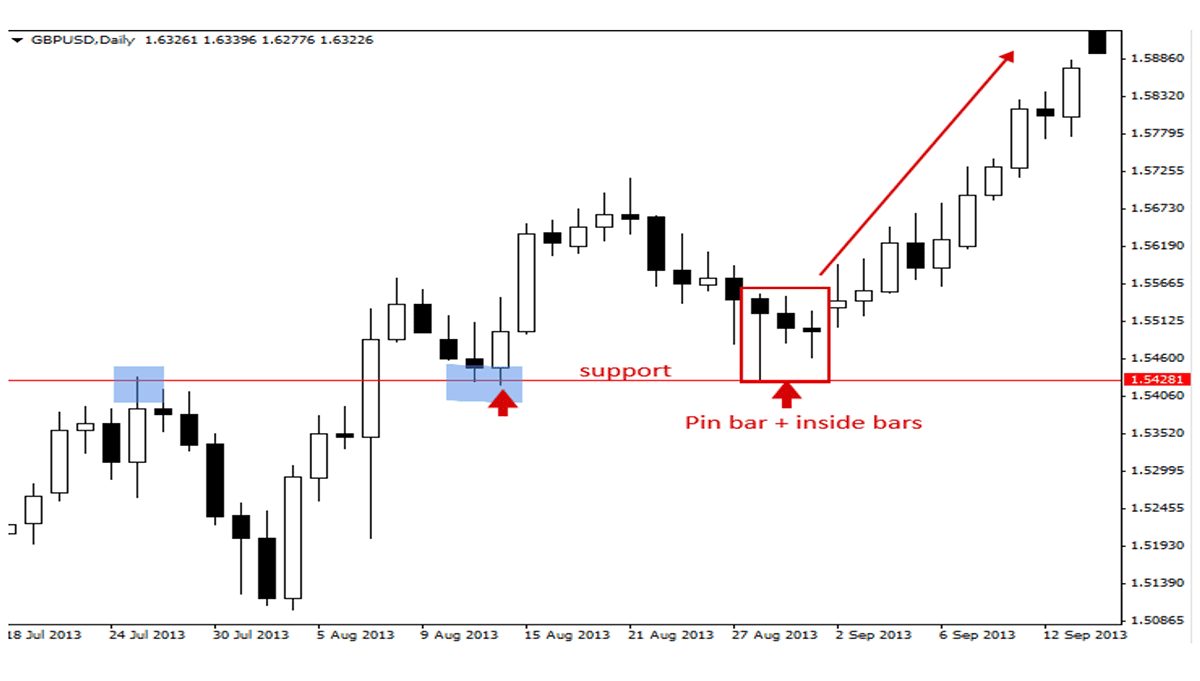
A Pin Bar and Inside Bar Combo Trading Strategy(GBP/USD -Daily Chart)
2. Support and Resistance Levels Trading Strategy
Support and resistance levels are horizontal price levels that typically connect price bar highs to other price bar highs or lows to lows, forming horizontal levels on a price chart.
A support or resistance level is formed when a market's price action reverses and changes direction, leaving behind a peak or trough (swing point) in the market. Support and resistance levels can carve out trading ranges, as seen in the chart below, and they also can be seen in trending markets as a market retraces and leaves behind swing points.
Price will often respect these support and resistance levels; in other words, they tend to contain price movement until the price breaks through them.
The chart below shows an example of support and resistance levels containing prices within a trading range. A trading range is simply an area of the price between parallel support and resistance levels, as we see below (price oscillates between the support and resistance levels in a trading range).
Note that in the chart below, the price eventually broke up and out of the trading range, moving above the resistance level; when it came back down and tested the old resistance level, it held the price and acted as support…
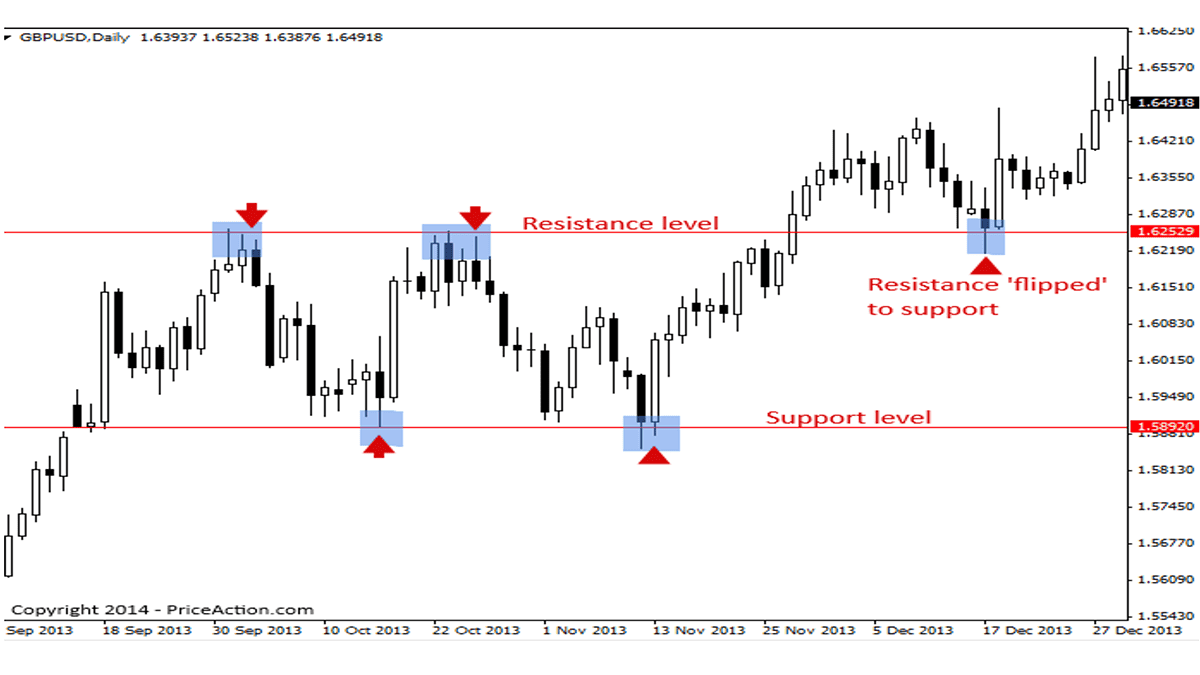
Support and Resistance Level Trading Strategy(GBP/USD-Daily Chart)
3. False Breakout Trading Strategy
False breakouts are exactly what they sound like: a breakout that failed to continue beyond a level, resulting in a 'false' breakout of that level. False breakout patterns are one of the most important price action trading patterns to learn because a false break is often a solid clue that the price might be changing direction or that a trend might be resuming soon. A false break of a level can be considered a 'deception' by the market because it looks like the price will break out, but then it quickly reverses, deceiving all who took the 'bait' of the breakout.
The chart below shows a clear downtrend and multiple false breakouts to the upside within that trend. When you see a false breakout against a dominant trend like this, it's usually an excellent signal that the trend is ready to resume. Amateur traders love to try and pick the bottom in a downtrend or the top in an uptrend, which can cause false breakouts against the trend, as we see below. On each of these false breaks in the chart below, it was likely that amateur traders thought the downtrend was over, and so they started buying. Once this buying started, the professionals came back in, took advantage of the temporary strength within the down-trending market, and entered short from value. Then the downtrend resumed, flushing out all those amateur traders who tried picking the bottom.
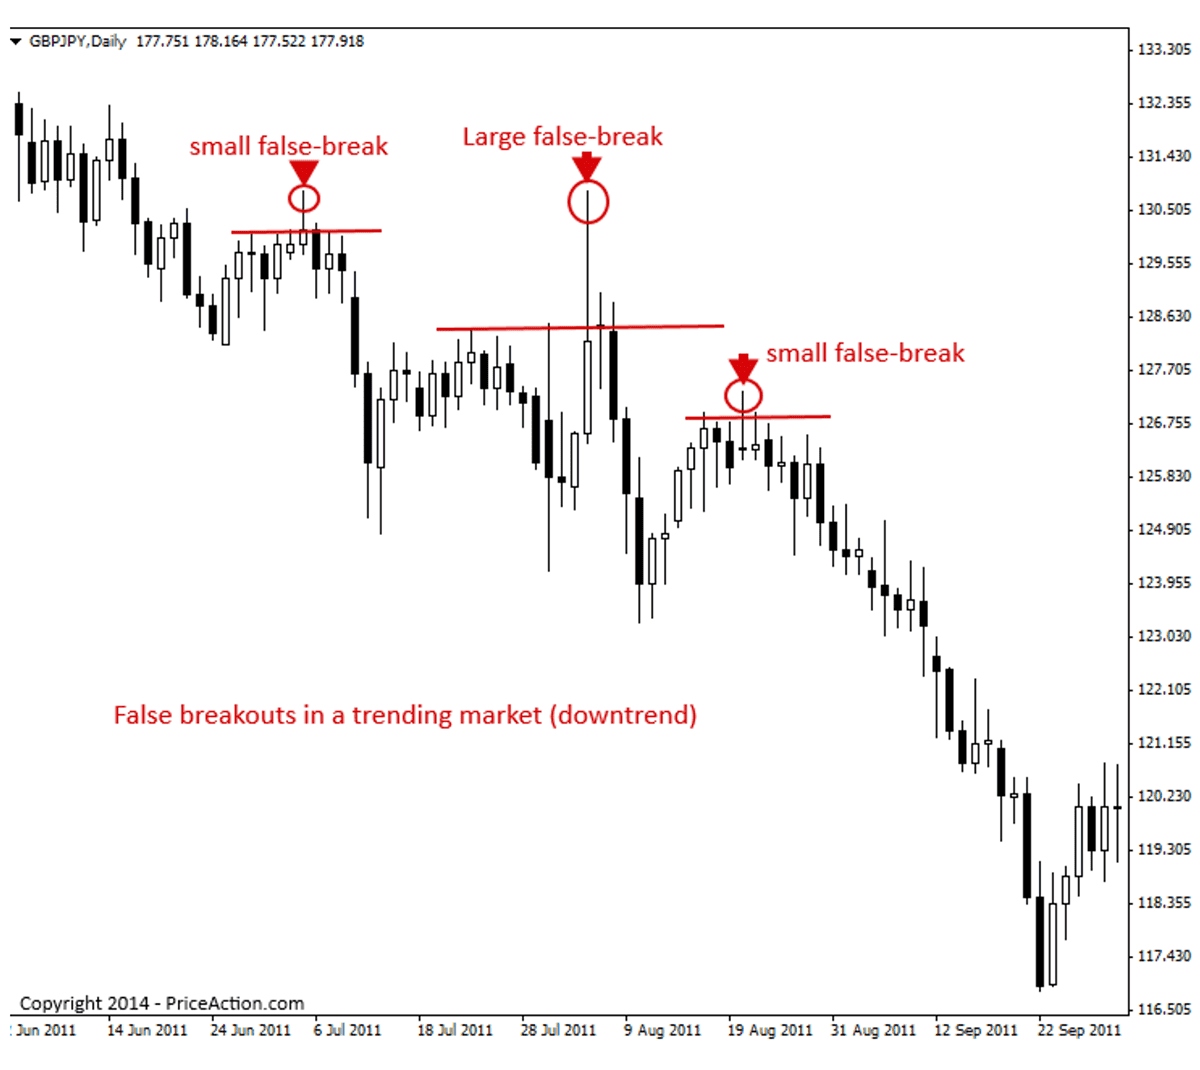
False breakout strategy in a downward trending market(GBP/JPY-Daily Chart)
Generally speaking, a false break happens because amateur traders or those with 'weak hands in the market will tend to enter it only when it 'feels safe'. This means they tend to enter when a market is already quite extended in one direction (and it's about ready to retrace), or they try to 'predict' a breakout from a key support or resistance level too early.
Is Price Action Profitable
Like any trading strategy or tool, profitability depends on how it is employed. Many successful investors and traders have all shown that trading price action trading can be profitable. However, traders that focus on price charts alone and do not take into account fundamental factors, such as economic indicators and news announcements, may miss key events that may have a major impact on their trading portfolio overall profits.
Why you should trade Based on Price Action
First, signals produced by price action are pretty easy to detect. To understand price action strategies, you do not necessarily need to hold a Master's degree in Economics or Finance. Access to price action is allowed to anyone willing to devote a certain amount of time studying its basic ideas.
Secondly, the time frames in which you trade are of specific significance. Some price action traders prefer to use daily or weekly time frames, considering them more reliable. This is so because one daily bar contains a considerably greater amount of data compared to one 5-minute bar. The more data, the more reliable the signals produced by the bar are. These signals have a more significant potential to lead to a successful trade.
Third, consistent gains in the currency market are obtained through a flexible trading method. Either in a trading range or a strong trend, the Forex market is highly dynamic. It would be best if you relied solely on price action strategies to take advantage of market movement. No lag is present; either there is a candle setup, or there is not.
What are some Limitations of Price Action Trading
Price action is often subjective, and traders may interpret the same chart or price history somewhat differently, leading to different decisions. Another limitation is that past price action is not always a valid predictor of future outcomes. As a result, technical traders should employ various tools to confirm indicators and be prepared to exit trades quickly if their predictions prove incorrect.
The Bottom Line
As a new trader, you can benefit significantly from learning price action trading. Learning to read and interpret price chart movements becomes a trading system on its own. It can help if you implement other analysis tools, such as statistics, indicators, or seasonality.
If you're learning to trade, you only need to know one method to start. Become profitable with your chosen strategy before trying to learn more. Price action trading doesn't guarantee profits, but it makes an excellent trading style with time and practice.

Looking to start trading using the Price Action Trading strategy, On Pocket Trader, you join the wider trading community to discuss trading ideas, validate plans, learn how to read between the candles to identify trading opportunities, and overall lift your trading game to master the markets.
As a beginner, you can stick to a demo trading account to learn the tricks of the trade in a safe, risk-free environment before you commit real money while still getting the most out of linking up with more experienced traders.